Fountainheadinvesting

Fountainhead Investing

  • Objective Analysis: Research On High Quality Companies With Sustainable Moats
  • Tech Focused: 60% Allocated To AI, Semiconductors, Technology

5 Star Tech Analyst Focused On Excellent Companies With Sustainable Moats

Categories
Market Outlook

SPY: Too Many Negative Indicators (Ratings Downgrade)

Summary

  • I’m downgrading my S&P 500 January Buy call to a Hold because of several negative indicators, including the massive tariffs levied on April 2nd.
  • While I had estimated an initial drop to 5,500, I’m reducing my lower target further to 5,000.
  • Caution and capital conservation now take precedence over growth.
  • Tariffs, inflation, weakening business sentiment, investor anxiety, and uncertainty remain significant concerns impacting the market outlook.
Bear Market - Recession
Douglas Rissing/iStock via Getty Images

In January 2025, I wrote an optimistic article recommending a Buy on the S&P 500 (SP500), (NYSEARCA:SPY), citing a still resilient economy, earnings momentum, AI optimism, and the re-emergence of animal spirits, trumping the negatives of tariffs, inflation, and uncertainty over government policies and immigration controls. But I also mentioned that we would likely see the index touching 5,500 before moving upward to 6,500. I’m now lowering targets even further to a possible 5,000 on the lower side with a recovery to 6,000 by the end of the year – essentially flat on an annual basis for the 1st year of the Trump presidency.

What Has Changed?

These are why I feel that the correction will likely lead to a possible bear market drop of 20%.

  1. The worldwide tariffs imposed on April 2nd.
  2. The sharp drop to a 10% correction in just 21 days.
  3. The feeble bounce back running into a strong 200 DMA resistance.
  4. Weakening economic indicators.
  5. The weakness in the M-7.
  6. Escalating trade tensions.
  7. Lower earnings could lead to lower multiples.
  8. Stagflation prevents the Fed from lowering interest rates.

The April 2nd Tariffs

The Trump administration imposed tariffs on our trading partners and nations across the world, in an effort to bring manufacturing back to U.S. shores.

Tariffs went up across the board, based on calculating the trade deficit with each nation and dividing it by 2, as a “Discount”. Here’s an example – China exported $438 Bn to the U.S. last year, but imported only $143 Bn, giving the U.S. a trade deficit of $295 Bn or 68% of $483 Bn; therefore, China’s tariff rate was calculated at 34%. The same formula was derived for each trading partner, with a minimum of 10%. Here is the complete list.

According to Deutsche Bank economists, the average tariff rate on U.S. imports would go up from 9% to a range of 25% and 30%.

As of writing, the S&P is down 3.57% to 5,469, 11.4% from its high of 6,147, in firm correction territory and, in my opinion, heading to a bear market drop of 20%.

While the tariffs were created to bring more jobs back to the U.S., by inducing exporters to set up plants in the U.S., that would take a decade, in my opinion, and a significant amount of Capex, subsidies, and private-public partnerships.

For example, TSMC (TSM) is estimated to have spent up to $65 Bn on its Arizona plant, which took about 5 years to get running and included about $6.6 Bn in Chips Act subsidies, and $5 Bn in loans. Secondly, it would be extremely difficult and expensive to make products like the iPhones because we’ve lost the process manufacturing expertise. The iPhone was designed in the U.S. but made in China by Foxconn with chips from TSM – from 2008 to 2025, which is 17 years of process manufacturing expertise that the U.S. will find difficult to regain at a reasonable price – It took India close to 5–7 years to get some of the iPhone manufacturing right, and that too under Foxconn control.

In the meantime, the U.S. consumer is likely to get an additional inflation shock of 1.5%, which could tip the country into a recession.

The Sharp Drop

The market dropped to 5,504 on March 13th, a correction of 10% from its February 19th top of 6,147, in an amazingly short span of just 21 days. At 6,147, the S&P 500 had made a double top compared to the previous high of December 6th of 6,099, which itself should have been a warning of the market topping out. The sharpness of the drop made it the 11th fastest in history.

Here are the 59 corrections, and not surprisingly, the COVID-19 correction was the fastest. It does show weakness in being in the same bracket as a COVID-19 correction. The sharp drop denotes price action that reflects far too much anxiety and uncertainty from investors, especially when economic news hasn’t been comparably terrible. The last payroll report showed us at just 4.1% unemployment, which is close to full employment, and yet skittish investors drove the market down 10% in just 21 days!

History of S&P 500 Corrections (Isabel.net, Bloomberg Finance, Deutsche Bank)

The Bounce Back Had No Backbone

The feeble bounce back ran full tilt into a strong 200 DMA resistance line and fell like a rag doll.

I believed that the market was oversold, and it did recover for about a week, with at least one of the catalysts being the Nvidia (NVDA) GTC annual conference. I suspect another catalyst was the hope of less onerous tariff announcements. However, it ran into strong resistance at the 200 DMA line, getting to 5,776 on March 25th, as we can see below, and slid back in a few days, ending the month lower at 5,612. With the reciprocal tariff announcements on April 2nd, the index has failed to hold the 10% correction line and is down 11.4% as of writing.

Chart
Data by YCharts

Weakening Economic Indicators

I believe the soft indicators will eventually show up in the hard lagging data, such as unemployment, payrolls, and GDP reports:

I find the soft indicators of surveys and polls extremely useful, especially when a majority of them are moving in the same direction as they did in February and March. For someone like me who is heavily weighted towards high beta stocks, such as the Magnificent Seven, semiconductors, cyber securities, or fast growth stocks, they are a good warning sign of impending trouble. It gives me a chance to de-risk, which I did and saved about 15-25% by selling portions of my portfolio. It turned out to be a good hedge.

Small Business Survey

In a March 27th article, Barron’s reported pessimism among small businesses, citing the Fed’s small business survey; I strongly believe that this manifests in weaker employment and slower GDP growth from Q2-2025.

Small businesses, classified as fewer than 500 employees, are the biggest employers in the country, accounting for almost 50% of America’s workforce, and about 43% of the country’s revenues or GDP.

There is a wave of pessimism around this cohort for several reasons, mainly,

  1. Uncertainty over the passage or renewal of the tax cuts of 2017.
  2. Rising cost of production
  3. A lack of clarity over tariffs and labor.
  4. Delays in planning and budget outlays are expected because of these uncertainties.

Crucially, this cohort has lost the post-pandemic recovery momentum with revenue and employment stagnation and decline. Worse, it has added debt in 2024 to tide it over.

From the Barron’s article:

In 2024, more small businesses reported their revenues decreased (41%), than those that saw an increase (38%). That’s the first time that has occurred since 2021. Profitability was a bit better, with 46% of small businesses reporting they operated at a profit in 2024.

From the Fed Small Business Survey

“Small businesses, because of the uncertainty, are starting to feel the squeeze,” says Tom Sullivan, the chamber’s vice president of small business policy. Owners are not “poised for growth,” which Sullivan says is concerning, considering small businesses are a primary job and innovation generators within the U.S. economy.

The University of Michigan Sentiment Index

The March 14th reading was abysmal. Coming in at 57.9, 5.1 points below expectations of 63, it was a whopping 6.8 points below the previous month. The biggest contributors to the angst were:

  1. The rollercoaster of stomach-churning tariff changes and economic policies.
  2. High inflation expectations of 4.9% – the highest since 2022.
  3. Worse, long-run inflation expectations rose 3.9% from 3.5% in the previous month, a monthly jump not seen since 1993.

From the director of consumer surveys at the University of Michigan, Joanne Hsu:

Many consumers cited the high level of uncertainty around policy and other economic factors; frequent gyrations in economic policies make it very difficult for consumers to plan for the future, regardless of one’s policy preferences.

Stagflation – Higher Inflation and Lower Growth

During their March 19th meeting, the Federal Reserve, while leaving their benchmark rates unchanged, made three key changes from their January meeting estimates.

  1. Inflation expectations rose from 2.5% to 2.7%
  2. GDP estimates lower from 2.1% to 1.7% – that is a large decline.
  3. The unemployment rate was revised to 4.4% from 4.3%

Stagflation hurts at both levels, and also hamstrings the Fed from reducing rates fast enough to revive the economy if GDP and employment falter.

The tariffs levied as of April 2nd will likely increase inflation by another 1.5% and reduce GDP growth to 1%.

Weakness in the M7

The Magnificent 7 stocks, which take up the lion’s share (31%) of the S&P 500 index and are a ubiquitous presence in our lives, have fallen like nine pins in this quarter. All of them are down over 20% from their 52-week highs, with Tesla (TSLA) leading the pack at 46%, followed by Nvidia at 33%. Everyone sells their family jewels last, and if the carnage is engulfing the best and the brightest, I think the S&P 500 will take a while to regain its footing.

Escalating Trade Tensions

Far from trade and tariffs being resolved through peaceful bilateral trade negotiations among business partners, the constant refrain coming from trade partners, friends, and neighbors has been one of disappointment and disgruntlement. Here are a few examples of where this is heading.

From Japanese Prime Minister Shigeru Ishiba, after the U.S. turned down personal appeals not to levy 25% tariffs on auto exports:

What President Trump is saying is that there are both friends and foes, and friends can be more difficult. This is very difficult to understand.

A diplomatic answer, but a firm one, which has now led to trade meetings between South Korea, China, and Japan, an unthinkable proposition a while back.

And neighboring Canada has retaliated. From Doug Ford, the pugnacious Ontario premier.

I’ve spoken with Prime Minister [Mark] Carney. We agree Canada needs to stand firm, strong and united. I fully support the federal government preparing retaliatory tariffs to show that we’ll never back down.

And this is after April 2nd, with China leading the pushback:

The tariffs “violate international trade rules, severely infringe the legitimate rights of relevant parties and represent a typical act of unilateral bullying,” the department said in a statement translated by The Wall Street Journal.

I believe trade tensions will continue, disrupting the global economy.

Lower Earnings and Growth Could Lead to Lower Multiples

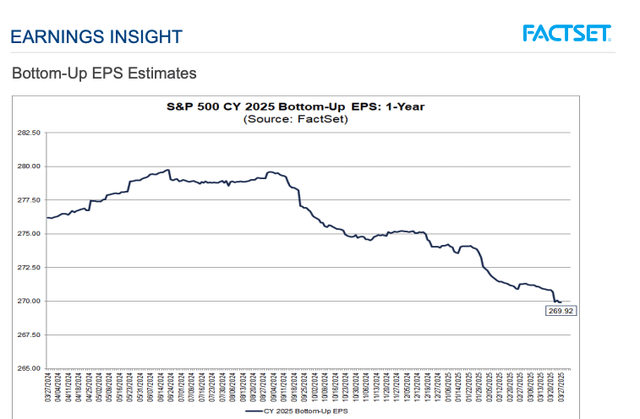
The latest report from FactSet shows that S&P 500 2025 earnings estimates have dropped from $280 per share to $270 per share and are trending lower.
S&P 500 Earnings Per Share
S&P 500 Earnings Per Share (FactSet)

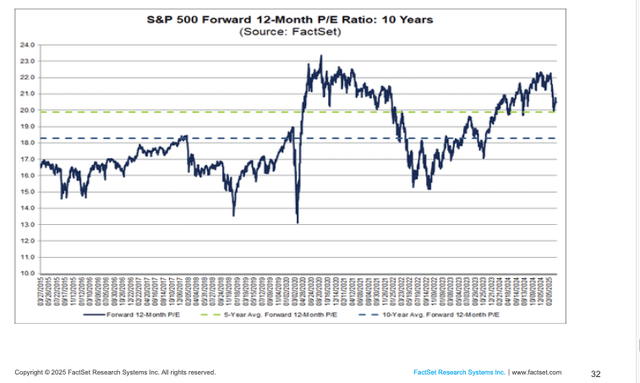
Further, even after the 10% correction, the S&P 500’s P/E ratio has barely touched the 5-year average of 20. And to everyone, the average of 20 had two positive components: corporate revenue and earnings growth, and lower interest rates. Now, with earnings declining, and the 10-year treasury yield over 4.2%, the P/E will veer towards the lower 10-year average of 18.2. Multiples always compress in tough times, and I don’t expect this time to be an exception.
S&P 500 P/E Ratios
S&P 500 P/E Ratios (FactSet)

Goldman Sachs went even further, dropping their GDP outlook to just 1%, inflation to 3.5%, and increased unemployment estimates to 4.5%. Clearly, they too want to get ahead of it and have even lobbed in a dreaded recession estimate of 35%. I expect more to follow.

Stagflation Prevents the Fed From Loosening

On March 28th, the Core CPE – the Fed’s preferred inflation gauge inched up a little more than expected at 0.4% MoM versus the 0.3% consensus. It was also a tad higher than January’s 0.3%. That translated to an annual increase of 2.8% vs the 2.7% estimate. It, too, was slightly higher than the previous month’s gauge of 2.7%.

The CPE, which increased 0.3% MoM and 2.5% YoY, matched both monthly and consensus estimates.

Personal Savings grew as personal income exceeded personal spending!

Personal income grew +0.8% M/M, vs the 0.4% estimate, and beat the previous month’s 0.7%. It dwarfed personal spending, which only grew 0.4% MoM, thus allowing the personal savings rate to grow to 4.6% in Feb, V 4.3% in Jan. In a growing or steady inflationary environment that we’ve been seeing for the past years, it becomes exceedingly difficult for the Fed to lower rates when needed, without stoking inflation.

The Strategy For The Rest Of 2025

Coming back full circle, there are far too many negatives to ignore and just ride the AI train, which rewarded me very well for two years, and it would be more prudent to play defense, conserve capital, and raise cash. I think Warren Buffett’s $334 Bn cash hoard is telling us something.

As I mentioned in my last article, two years of 23% sequential gains have happened only 3 times in a century. The chances of a reversal or a stagnant market in 2025 are extremely high; thus, caution would be the biggest objective and strategy.

My portfolio is tech-focused, I’ve been taking profits on tech stocks intermittently, raising cash and diversifying into ETFs, consumer staples, defensives, and also looking at global indices.

Categories
Market Outlook

A Lack Of Consumer Confidence

Market Outlook: Conference Board’s Consumer Confidence Index

Anxiety is rife as Conference Board’s Consumer Survey Drops to a 12-Year Low

A Negative view: The February survey of household sentiment showed that expectations for income, business, and labor-market conditions fell to a jaw-dropping 65.2, a 12-year low. A level below 80 often signals a recession, according to the Conference Board.

And it’s not just forward data – Consumers’ view of the current situation fell to 92.9, V 93.5 expected, down 7.2 MoM, marking four straight months of declines.

Still, there were silver linings, such as the view on labor markets –
33.6% of consumers said jobs were plentiful, no change from the previous month, while 15.7% disagreed, claiming that jobs were hard to get, which was also unchanged from 16% in February.

Inflation remained a major concern, with consumers outlining trade policies and tariffs as root causes.

The Fed balances real-time data with these surveys, as do Wall Street and other analysts, looking for cracks in the economy. So far, nothing has translated into actual reports, which naturally lag these leading indicators. Unfortunately, these turn out to be self-fulfilling prophecies towards a vicious downward cycle unless turned around quickly.

The Fed’s dilemma to balance and maintain the dual mandate of full employment and low inflation continues, as soft data from forward-looking surveys convey anxiety about the economy, data which has yet to show up in current reports such as monthly payrolls, unemployment claims, the JOLTS report, or the GDP numbers. Should these weak surveys show up in the jobs numbers, the Feds would have a hard time justifying rate cuts to goose the economy given stronger and stickier inflation.

Categories
Market Outlook

Annual Earnings Forecast for Q2-2024

Analysts forecast that the S&P 500 index’s earnings will likely grow above 12% for the second quarter and about 11-12% for the year to 247.

Source: FactSet

This is way above the 8% average growth, mostly because of a weaker Q2-2023, when earnings actually declined 4% over the previous year. 

Besides, S&P 500 earnings have been stagnant at $220 for the past two years so 2024 had beat the average significantly just to catch up and revert to the mean. 

Here are past 5 years – basically smoothening out the effects of Covid. After the big pandemic fall of 14% in 2020, there was that massive jump of 48% in 2021, and then two years of indigestion and inflation, which now leads to the 12% expected jump in 2024.

FactSet estimates that over the past ten years, actual earnings reported by S&P 500 companies have exceeded estimated earnings by 6.8% on average – everybody sandbags, (under promises and over delivers). I wouldn’t be surprised if earnings actually close over $250 for 2024.

Great, earnings look good with the 11-12% increase, but what about valuations?

The bottom-up target price for the next 12 months for the S&P 500 is 6006.66, which is 7.6% above the closing price of 5,584.54. 

The Forward P/E Ratio is 21.4, which is above the 10-Year Average (17.9), and above the 5-year average of 19.3. 

The two main causes for the high P/E 

a) Out performance and AI expectations, from the Magnificent 7, which controls about 33% of the index.

b) Decline in inflation and expectations of interest rate cuts.

I believe there is exhaustion in the M-7 – there is over participation (everybody and their uncle own Nvidia) and over bought. We we saw it for a bit in the last 3 weeks with Nvidia slowing down, but Apple and Tesla picked up the slack – Tesla rose 40% and 7 days in a row! What looked like a possible correction in the middle of June, never really materialized.

Secondly, now the 10 year has finally come down to about 4.19% and two interest rate cuts are a certainly after benign inflation numbers (still high over 3% and above the Fed target of 2% but definitely in the right direction). I believe the 10 Year will be between 3.5% and 3.75% for the most of 2025, if not lower.

Strategy for the second half of 2024 and beyond. High valuations should keep the index in check, and even cause a 5-7% correction, which is actually a good thing in my opinion. Lower interest rates will keep a floor.

What should we do? In my opinion, 

  1. Lower expectations for sure, if we make a return of 8-10% a year + dividends, that’s great, thus with this target, we can lower risk as well. For most of the year, almost every stock I had recommended had expectation of at least 15% Returns.
  2.  You don’t have to necessarily move away from tech but a mixture of Growth At a Reasonable Price (the GARP strategy) and absolutely looking for and investing in bargains should be the cornerstone of investing for the next 12 months. In two cases recently, GitLabs (GTLB) and Samsara (IOT) waiting for bargain prices have worked very well. I started the first 5% purchase, higher and slowly worked my way down as they kept falling and in both cases the prices are 15- 20% higher than my average cost.
  3. Keep cash handy for corrections and drops – On June 19th, I had sold 15-20% of semi stocks as profit taking; I’m still holding onto about 10% cash, which at 4-5% in money market funds is safe and I won’t invest till I get an outstanding bargain.
  4. Rotation – This week I’ll identify and recommend some GARPS, some dividend picks, and cyclicals.
  1. I picked up Duolingo, consumer, which is expensive – about 40% invested but am adding in the 190 range.

I’ve been pyramiding in the two big pharma companies – Eli and Novo, which is the exact opposite of cost averaging, buying smaller quantities even as they get higher, simply this obesity craze will last, and they’re relatively inured with strong pipelines.

Categories
Market Outlook

 Earnings season for Q2-2024

As usual, the first to report were the big banks. I always look at credit provisioning and charge offs as indicators of economic weakness. 

JP Morgan (JPM) confirmed guidance for the rest of the year for earnings and revenue; earnings growth will be less than 1%, while revenues will grow at a modest 5%. JPM did increase credit loss provisioning to $3.05Bn, higher than 2.8Bn earlier, this is also higher than 1.88Bn in Q1, and 2.9Bn in Q2. Charge offs (mainly on credit card delinquencies) were also higher by $820Mn at $2.2Bn. Jamie Dimon, CEO of JP Morgan, was cautious as usual, JPM tends to over-provide for losses and has been doing it for years.

Wells Fargo (WFC) didn’t need to increase provisioning, but its charge offs were also higher – net loan charge-offs, as a percentage of average total loans, increased to 0.57% from 0.50% in Q1 and 0.32% in Q2 2023.  WFC’s bigger problem is net interest income, it now expects full-year 2024 net interest income to fall 8%-9% from 2023’s $52.4B, compared with its prior guidance of down 7%-9%.

Citi (C) was mixed with higher charge offs but lower provisioning, and also commentary from the CEO, that lower FICO score customers are pulling back on spending. In addition, he’s seeing signs that delinquencies may be bending back down.

These don’t set off any alarm bells but does confirm what we’ve been hearing for most of the year, that outside of tech, the economy is lackluster, and that inflation is stunting growth, especially for lower and middle income groups.

Categories
Market Outlook

Savita Subramanian on the state of the markets

A Summary of Barron ’s interview with Savita Subramanian – head of U.S. equity and quantitative strategies at BofA Securities

Definitely one of the smarter strategists on Wall Street with a lot of prescient calls, especially being one of the first to raise the S&P 500 2024 target to 5,400, a level we passed yesterday.

https://www.barrons.com/articles/large-companies-value-stocks-market-rally-subramanian-21f7c4c2?mod=hp_LEADSUPP_1

“If I were going to buy one kind of investment for the next 12 to 24 months, it would be large-cap value. That’s where you’re going to get the most bang for your buck. That’s what will lead over the next few years, given the macro environment.” 

“At the beginning of the year, it was much easier to be bullish because there were a lot more bears. And at this point, I feel like a lot of the bears have capitulated.”

“I’m not worried about equities from a valuation perspective because these multiples are sustainable.”  “Inflation volatility has subsided. This is where clients probably disagree with me the most, but I feel that what the Fed does now is less important because it has already done the extreme process of hiking.”

I agree with this to a great extent – interest rate cuts, higher for longer, neutral interest rates have a marginal impact. Directionally, the 10 year is moving lower, and except for shelter inflation, which has a variable called “notional rent” (A computed number based on what you would pay if you were renting your home today), a majority of other indicators have been moving lower.

​​” Until we get to that moment where the Fed says we’re at peak rates, inflation is coming down, and we can be more accommodative, you want to hold inflation-protected sectors such as energy, materials, and financials. These are more cyclical than defensive sectors.”

“When we were in more of an inflationary environment, we wrote about how the best environment for equities was 2% to 4% inflation. That’s where we are right now. The best environment for equities is when real wage growth is positive and nominal sales growth is at reasonable levels.”

A somewhat Goldilocks scenario…

“But I am surprised by how narrow the market has become. I would have expected a broadening out to have happened earlier.” “The earnings of the mega cap tech cohort are so high that we are more likely to see a deceleration than an acceleration. Another reason to expect a broadening out is that we got positive guidance across the board, and not just from tech companies, during first-quarter earnings season.”

“I like a mix of companies that are generating strong free cash flow and enjoying the benefits of this tech revolution, but also companies that are potentially becoming more labor light. If you think about the areas that could benefit from generative artificial intelligence, it’s banks, legal services, and IT [information technology] services.”

“And if you think about cash flow, it isn’t just tech but also utilities, power, infrastructure, and energy companies that are generating substantial amounts of cash. Some are exciting, and some are boring. But they are mostly big. That’s where I differ from a lot of other bulls. I don’t think you want to buy all small-caps, because while some of them are economically sensitive and will benefit from better gross-domestic-product growth in the U.S., others are morphing into smaller-cap companies because they used to be large.”

So be selective, the devil is in the details – cash flow, operational performance are paramount regardless of small, big, value, boring, tech – BUY THE BUSINESS, Buffet style..

When asked about the election – “The fact that both candidates agree that they want to bring back manufacturing from China and other regions of the world to the U.S. has created more jobs. While these policies are protectionist and inflationary, they are also pro-growth.”

“Right now is the most interesting time to be a market strategist, in my opinion. We’re back to a more rational market. When we were in a zero-interest-rate, massive-stimulus-driven market, it was hard to forecast what would happen next. Events were in the hands of central bankers.” “The outlook depends less on central bankers, and more on corporations and consumers.”

Its a very practical approach, and its folks like Savita, who are instrumental in allocating investment capital – this is not a theoretical, economists top down approach, which at the end of day is much less influential/meaningful for investors.

Categories
Market Outlook

 Fed Officials Dial Back Rate Forecasts, Signal Just One ’24 Cut

Officials acknowledge ‘modest further progress’ on prices

Fed boosts estimate of long-run neutral rate further

Federal Reserve officials penciled in just one interest-rate cut this year and forecast more cuts for 2025, reinforcing policymakers’ calls to keep borrowing costs high for longer to suppress inflation.

They now see four cuts in 2025, more than the three previously outlined.

The Federal Open Market Committee adjusted language in its post-meeting statement released Wednesday, noting there has been “modest further progress toward the committee’s 2% inflation objective” in recent months. Previously, the statement pointed to a “lack” of further progress.

The S&P is still up 0.96% and the 10 year is at 4.29% – no major reaction.

Categories
Market Outlook

 Payrolls Report For May 2024

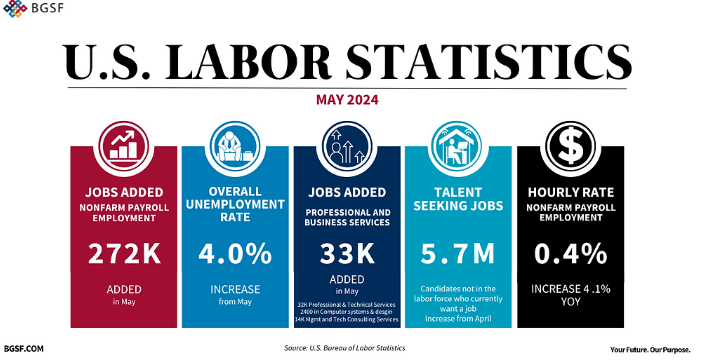
US Payrolls Rose by 272,000 in May, smashing Estimates of 180,000

The wage gain is also strong, at 0.4%, double the pace of the average hourly earnings advance of the previous month.

The unemployment rate is up, though, that’s as the labor force participation rate fell — unfortunate news for the Fed.

  • May nonfarm payrolls: +272K vs. 182K expected and 165K prior (revised from +175K).
  • Unemployment rate: 4.0% vs. 3.9% expected and 3.9% prior.
  • Average hourly earnings rose 0.4% in May, accelerating from 0.2% in April and topping the 0.3% consensus. Y/Y, average hourly earnings increased 4.1%, compared with the +3.9% consensus and +4.0% in the prior month (revised from +3.9%).
  • Futures are down 0.4% and the 10 Year treasury yield has increased 13 points to 4.43%
Categories
Market Outlook

Jobs Report: June 2024

A good jobs report.

206,000 net new jobs V 190,000 expected.

4.1% unemployment rate, a bit higher than expected, the Feds expected this rate by Dec 2024.

Revisions are the bigger story with 57,000 and 54,000 lower revisions for April and May 2024. So, the 206,000 jobs for June may be revised as well following the trend.

Wage rate – Average hourly earnings climbed by 0.3% in June from the previous month, taking the annual increase to 3.9%.

Futures are flat, and the 10-year has dropped to 4.29%.