Fountainheadinvesting

Fountainhead Investing

  • Objective Analysis: Research On High Quality Companies With Sustainable Moats
  • Tech Focused: 60% Allocated To AI, Semiconductors, Technology

5 Star Tech Analyst Focused On Excellent Companies With Sustainable Moats

Categories
Market Outlook

Don’t Ignore The 10-Year Yield

The likelihood of only two Fed rate cuts in 2025 sent the markets tumbling yesterday, even as Chair Powell was still answering pointed questions about the resilience of the economy and where inflation was headed in 2025. The S&P 500 eventually closed 2.96% lower. shattering the post-election rally.

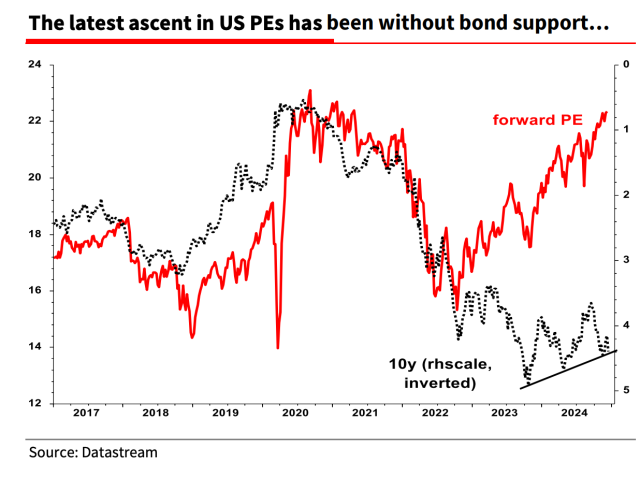
The markets had been ignoring the 10-year yield for far too long. The 10-year went from 3.6% in September when the Fed started cutting to 4.40% before the FOMC meeting, signaling that inflation wasn’t completely done and that stock valuations were getting frothy. It unraveled yesterday. Analysts are talking about the 10-year possibly reaching 5%, which will remain bad for stock multiples. The S&P 500 and the Nasdaq Comp are down 4.5% from their highs. Let’s see how the PCE report is on Friday.

The last time the S&P 500’s P/E ratio was 22, it was 2021, and the 10-year treasury yield was 1%! We are at 4.5% and climbing! The expectations of 4 cuts in 2025 had kept the markets hopeful that the 10-year would follow suit and head back below 4%. Clearly, that’s not happening. Either the index has to come down or the 10-year has to drop to justify these valuations….

Also don’t forget the Fed’s reluctance to cut big for forecast more cuts in 2025 was based on the Sep, Oct and Nov inflation readings, they’ve not even talked about the possible inflationary impact of tariffs and larger fiscal deficits – somebody has to fund the government when they’re not collecting enough taxes, and the weaknesses in the past two treasury auctions suggest that lenders are demanding better rates to lend to the government.

Categories
Market Outlook

S&P 500 Earnings Overview: Q4 2023 Insights and Valuation Metrics

FactSet reported the following for S&P 500 earnings through 2/9.

This is a very helpful 10,000 feet view and provides good benchmarking and comparisons.

Earnings Scorecard: For Q4 2023 (with 67% of S&P 500 companies reporting actual results), 75% of S&P 500 companies have reported a positive EPS surprise, which is below the 5-year average of 77% but above the 10-year average of 74%

Earnings Growth: For Q4 2023, the blended (year-over-year) earnings growth rate for the S&P 500 is 2.9%. If 2.9% is the actual growth rate for the quarter, it will mark the second-straight quarter that the index has reported earnings growth.

65% of S&P 500 companies have reported a positive revenue surprise, which is below the 5-year average of 68% but above the 10-year average of 64%.

In aggregate, companies are reporting revenues that are 1.2% above the estimates, which is below the 5-year average of 2.0% and below the 10-year average of 1.3%.  

If 3.9% is the actual revenue growth rate for the quarter, it will mark the 13th consecutive quarter of revenue growth for the index.

It is interesting to note that analysts were projecting record-high EPS for the S&P 500 of $243.41 in CY 2024 and $275.34 in CY 2025 on February 8. 

On February 8, the forward 12-month P/E ratio for the S&P 500 was 20.3, which marked the seventh time in the past nine trading days in which the P/E ratio for the index was above 20.0. How does this 20.3 P/E ratio compare to historical averages? 

Here is the chart for the historical PE, we have been above the 10 year average of around 18 for a while, and are now above the 5-year average of 19 as well.