Fountainheadinvesting

Fountainhead Investing

  • Objective Analysis: Research On High Quality Companies With Sustainable Moats
  • Tech Focused: 60% Allocated To AI, Semiconductors, Technology

5 Star Tech Analyst Focused On Excellent Companies With Sustainable Moats

Categories
Market Outlook

SPY: Too Many Negative Indicators (Ratings Downgrade)

Summary

  • I’m downgrading my S&P 500 January Buy call to a Hold because of several negative indicators, including the massive tariffs levied on April 2nd.
  • While I had estimated an initial drop to 5,500, I’m reducing my lower target further to 5,000.
  • Caution and capital conservation now take precedence over growth.
  • Tariffs, inflation, weakening business sentiment, investor anxiety, and uncertainty remain significant concerns impacting the market outlook.
Bear Market - Recession
Douglas Rissing/iStock via Getty Images

In January 2025, I wrote an optimistic article recommending a Buy on the S&P 500 (SP500), (NYSEARCA:SPY), citing a still resilient economy, earnings momentum, AI optimism, and the re-emergence of animal spirits, trumping the negatives of tariffs, inflation, and uncertainty over government policies and immigration controls. But I also mentioned that we would likely see the index touching 5,500 before moving upward to 6,500. I’m now lowering targets even further to a possible 5,000 on the lower side with a recovery to 6,000 by the end of the year – essentially flat on an annual basis for the 1st year of the Trump presidency.

What Has Changed?

These are why I feel that the correction will likely lead to a possible bear market drop of 20%.

  1. The worldwide tariffs imposed on April 2nd.
  2. The sharp drop to a 10% correction in just 21 days.
  3. The feeble bounce back running into a strong 200 DMA resistance.
  4. Weakening economic indicators.
  5. The weakness in the M-7.
  6. Escalating trade tensions.
  7. Lower earnings could lead to lower multiples.
  8. Stagflation prevents the Fed from lowering interest rates.

The April 2nd Tariffs

The Trump administration imposed tariffs on our trading partners and nations across the world, in an effort to bring manufacturing back to U.S. shores.

Tariffs went up across the board, based on calculating the trade deficit with each nation and dividing it by 2, as a “Discount”. Here’s an example – China exported $438 Bn to the U.S. last year, but imported only $143 Bn, giving the U.S. a trade deficit of $295 Bn or 68% of $483 Bn; therefore, China’s tariff rate was calculated at 34%. The same formula was derived for each trading partner, with a minimum of 10%. Here is the complete list.

According to Deutsche Bank economists, the average tariff rate on U.S. imports would go up from 9% to a range of 25% and 30%.

As of writing, the S&P is down 3.57% to 5,469, 11.4% from its high of 6,147, in firm correction territory and, in my opinion, heading to a bear market drop of 20%.

While the tariffs were created to bring more jobs back to the U.S., by inducing exporters to set up plants in the U.S., that would take a decade, in my opinion, and a significant amount of Capex, subsidies, and private-public partnerships.

For example, TSMC (TSM) is estimated to have spent up to $65 Bn on its Arizona plant, which took about 5 years to get running and included about $6.6 Bn in Chips Act subsidies, and $5 Bn in loans. Secondly, it would be extremely difficult and expensive to make products like the iPhones because we’ve lost the process manufacturing expertise. The iPhone was designed in the U.S. but made in China by Foxconn with chips from TSM – from 2008 to 2025, which is 17 years of process manufacturing expertise that the U.S. will find difficult to regain at a reasonable price – It took India close to 5–7 years to get some of the iPhone manufacturing right, and that too under Foxconn control.

In the meantime, the U.S. consumer is likely to get an additional inflation shock of 1.5%, which could tip the country into a recession.

The Sharp Drop

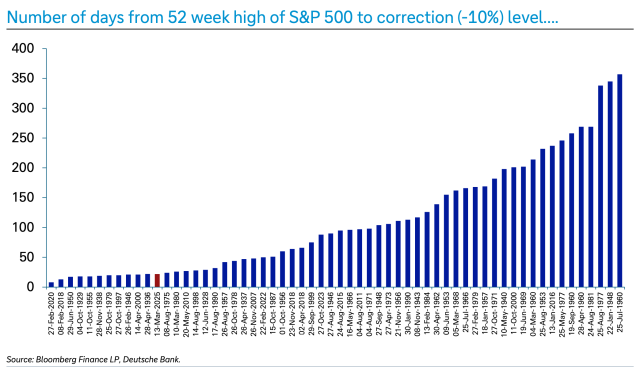
The market dropped to 5,504 on March 13th, a correction of 10% from its February 19th top of 6,147, in an amazingly short span of just 21 days. At 6,147, the S&P 500 had made a double top compared to the previous high of December 6th of 6,099, which itself should have been a warning of the market topping out. The sharpness of the drop made it the 11th fastest in history.

Here are the 59 corrections, and not surprisingly, the COVID-19 correction was the fastest. It does show weakness in being in the same bracket as a COVID-19 correction. The sharp drop denotes price action that reflects far too much anxiety and uncertainty from investors, especially when economic news hasn’t been comparably terrible. The last payroll report showed us at just 4.1% unemployment, which is close to full employment, and yet skittish investors drove the market down 10% in just 21 days!

History of S&P 500 Corrections (Isabel.net, Bloomberg Finance, Deutsche Bank)

The Bounce Back Had No Backbone

The feeble bounce back ran full tilt into a strong 200 DMA resistance line and fell like a rag doll.

I believed that the market was oversold, and it did recover for about a week, with at least one of the catalysts being the Nvidia (NVDA) GTC annual conference. I suspect another catalyst was the hope of less onerous tariff announcements. However, it ran into strong resistance at the 200 DMA line, getting to 5,776 on March 25th, as we can see below, and slid back in a few days, ending the month lower at 5,612. With the reciprocal tariff announcements on April 2nd, the index has failed to hold the 10% correction line and is down 11.4% as of writing.

Chart
Data by YCharts

Weakening Economic Indicators

I believe the soft indicators will eventually show up in the hard lagging data, such as unemployment, payrolls, and GDP reports:

I find the soft indicators of surveys and polls extremely useful, especially when a majority of them are moving in the same direction as they did in February and March. For someone like me who is heavily weighted towards high beta stocks, such as the Magnificent Seven, semiconductors, cyber securities, or fast growth stocks, they are a good warning sign of impending trouble. It gives me a chance to de-risk, which I did and saved about 15-25% by selling portions of my portfolio. It turned out to be a good hedge.

Small Business Survey

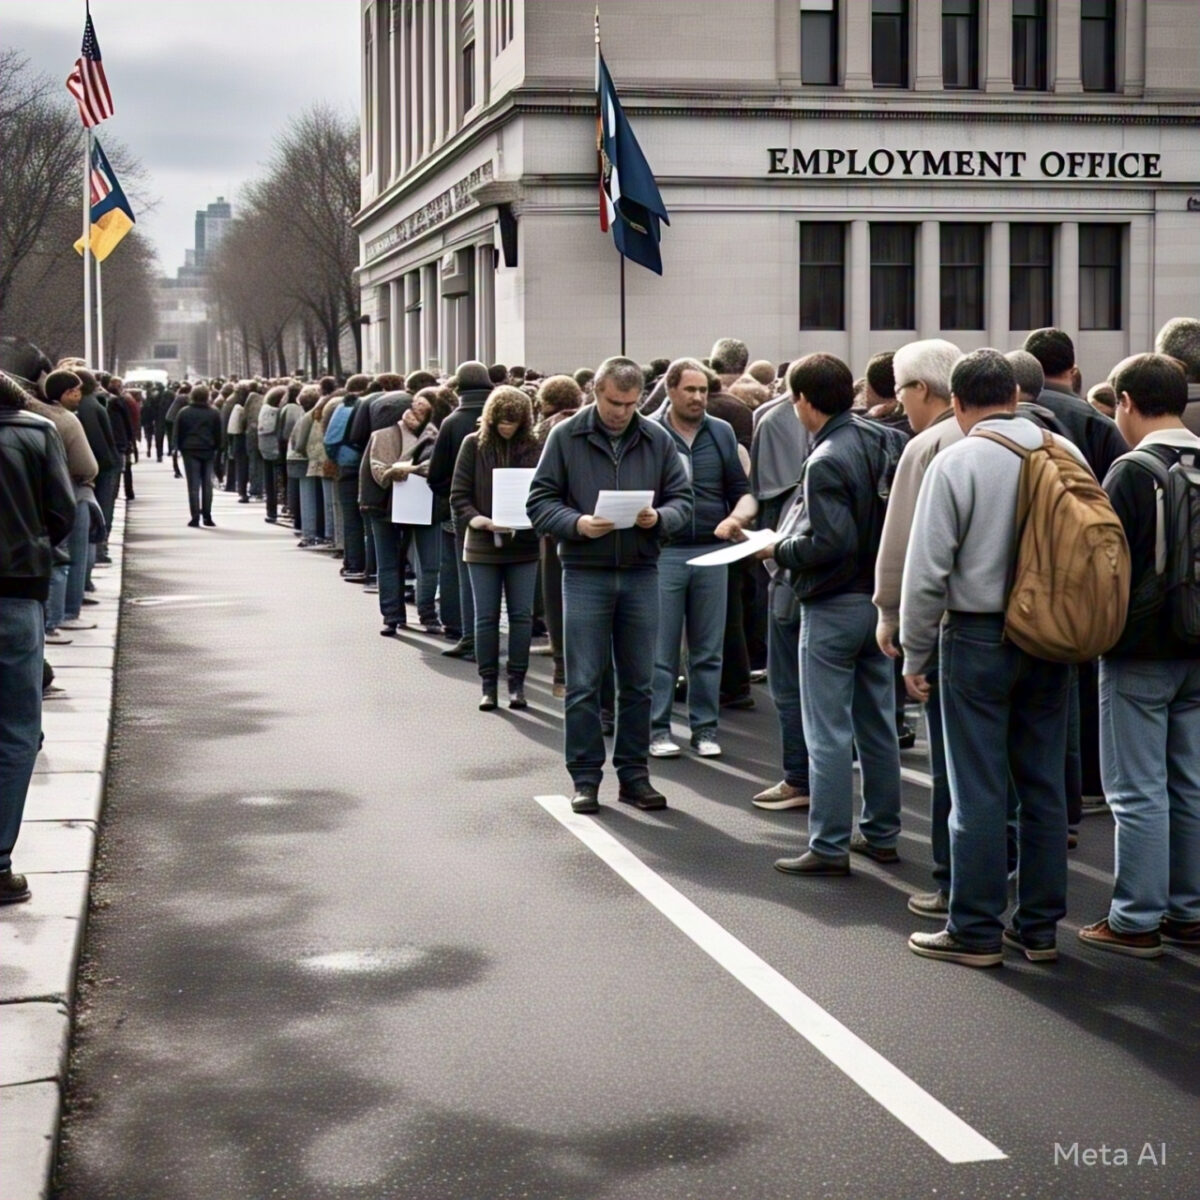
In a March 27th article, Barron’s reported pessimism among small businesses, citing the Fed’s small business survey; I strongly believe that this manifests in weaker employment and slower GDP growth from Q2-2025.

Small businesses, classified as fewer than 500 employees, are the biggest employers in the country, accounting for almost 50% of America’s workforce, and about 43% of the country’s revenues or GDP.

There is a wave of pessimism around this cohort for several reasons, mainly,

  1. Uncertainty over the passage or renewal of the tax cuts of 2017.
  2. Rising cost of production
  3. A lack of clarity over tariffs and labor.
  4. Delays in planning and budget outlays are expected because of these uncertainties.

Crucially, this cohort has lost the post-pandemic recovery momentum with revenue and employment stagnation and decline. Worse, it has added debt in 2024 to tide it over.

From the Barron’s article:

In 2024, more small businesses reported their revenues decreased (41%), than those that saw an increase (38%). That’s the first time that has occurred since 2021. Profitability was a bit better, with 46% of small businesses reporting they operated at a profit in 2024.

From the Fed Small Business Survey

“Small businesses, because of the uncertainty, are starting to feel the squeeze,” says Tom Sullivan, the chamber’s vice president of small business policy. Owners are not “poised for growth,” which Sullivan says is concerning, considering small businesses are a primary job and innovation generators within the U.S. economy.

The University of Michigan Sentiment Index

The March 14th reading was abysmal. Coming in at 57.9, 5.1 points below expectations of 63, it was a whopping 6.8 points below the previous month. The biggest contributors to the angst were:

  1. The rollercoaster of stomach-churning tariff changes and economic policies.
  2. High inflation expectations of 4.9% – the highest since 2022.
  3. Worse, long-run inflation expectations rose 3.9% from 3.5% in the previous month, a monthly jump not seen since 1993.

From the director of consumer surveys at the University of Michigan, Joanne Hsu:

Many consumers cited the high level of uncertainty around policy and other economic factors; frequent gyrations in economic policies make it very difficult for consumers to plan for the future, regardless of one’s policy preferences.

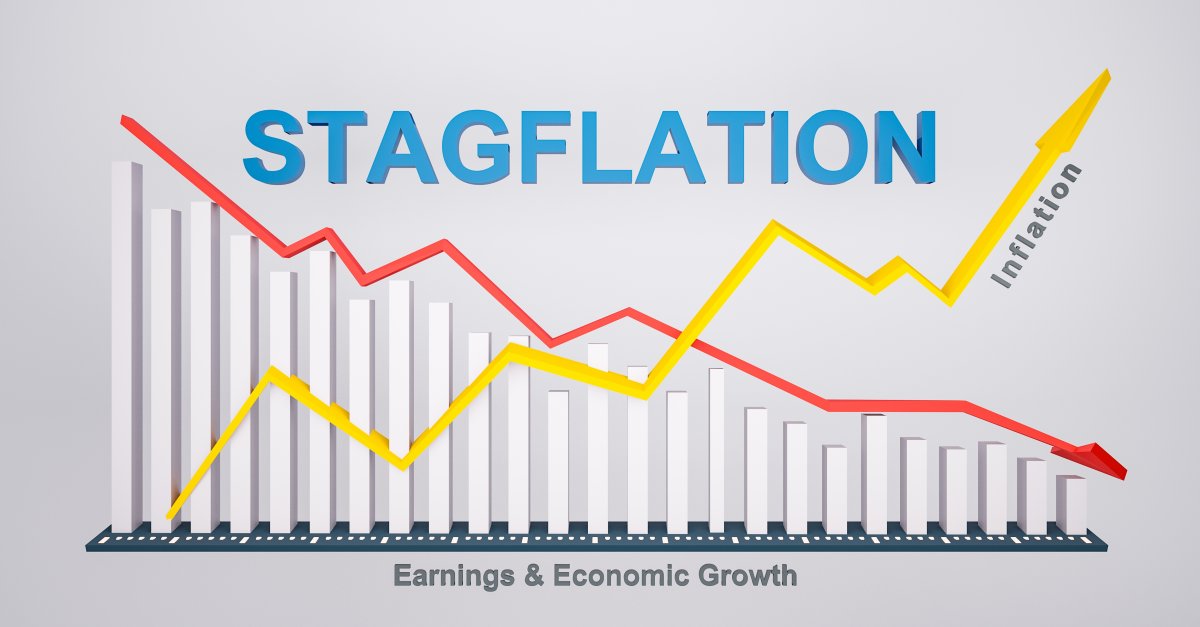
Stagflation – Higher Inflation and Lower Growth

During their March 19th meeting, the Federal Reserve, while leaving their benchmark rates unchanged, made three key changes from their January meeting estimates.

  1. Inflation expectations rose from 2.5% to 2.7%
  2. GDP estimates lower from 2.1% to 1.7% – that is a large decline.
  3. The unemployment rate was revised to 4.4% from 4.3%

Stagflation hurts at both levels, and also hamstrings the Fed from reducing rates fast enough to revive the economy if GDP and employment falter.

The tariffs levied as of April 2nd will likely increase inflation by another 1.5% and reduce GDP growth to 1%.

Weakness in the M7

The Magnificent 7 stocks, which take up the lion’s share (31%) of the S&P 500 index and are a ubiquitous presence in our lives, have fallen like nine pins in this quarter. All of them are down over 20% from their 52-week highs, with Tesla (TSLA) leading the pack at 46%, followed by Nvidia at 33%. Everyone sells their family jewels last, and if the carnage is engulfing the best and the brightest, I think the S&P 500 will take a while to regain its footing.

Escalating Trade Tensions

Far from trade and tariffs being resolved through peaceful bilateral trade negotiations among business partners, the constant refrain coming from trade partners, friends, and neighbors has been one of disappointment and disgruntlement. Here are a few examples of where this is heading.

From Japanese Prime Minister Shigeru Ishiba, after the U.S. turned down personal appeals not to levy 25% tariffs on auto exports:

What President Trump is saying is that there are both friends and foes, and friends can be more difficult. This is very difficult to understand.

A diplomatic answer, but a firm one, which has now led to trade meetings between South Korea, China, and Japan, an unthinkable proposition a while back.

And neighboring Canada has retaliated. From Doug Ford, the pugnacious Ontario premier.

I’ve spoken with Prime Minister [Mark] Carney. We agree Canada needs to stand firm, strong and united. I fully support the federal government preparing retaliatory tariffs to show that we’ll never back down.

And this is after April 2nd, with China leading the pushback:

The tariffs “violate international trade rules, severely infringe the legitimate rights of relevant parties and represent a typical act of unilateral bullying,” the department said in a statement translated by The Wall Street Journal.

I believe trade tensions will continue, disrupting the global economy.

Lower Earnings and Growth Could Lead to Lower Multiples

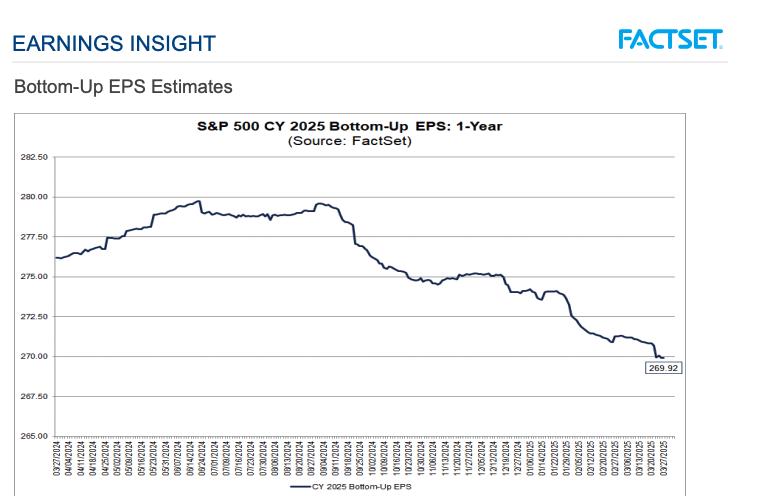
The latest report from FactSet shows that S&P 500 2025 earnings estimates have dropped from $280 per share to $270 per share and are trending lower.

S&P 500 Earnings Per Share
S&P 500 Earnings Per Share (FactSet)

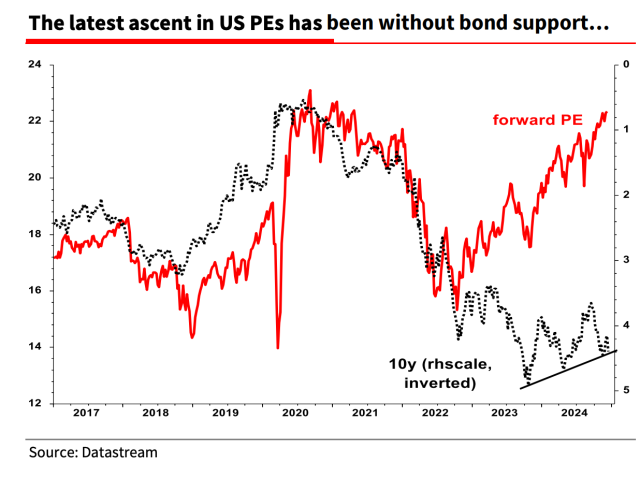
Further, even after the 10% correction, the S&P 500’s P/E ratio has barely touched the 5-year average of 20. And to everyone, the average of 20 had two positive components: corporate revenue and earnings growth, and lower interest rates. Now, with earnings declining, and the 10-year treasury yield over 4.2%, the P/E will veer towards the lower 10-year average of 18.2. Multiples always compress in tough times, and I don’t expect this time to be an exception.

S&P 500 P/E Ratios
S&P 500 P/E Ratios (FactSet)

Goldman Sachs went even further, dropping their GDP outlook to just 1%, inflation to 3.5%, and increased unemployment estimates to 4.5%. Clearly, they too want to get ahead of it and have even lobbed in a dreaded recession estimate of 35%. I expect more to follow.

Stagflation Prevents the Fed From Loosening

On March 28th, the Core CPE – the Fed’s preferred inflation gauge inched up a little more than expected at 0.4% MoM versus the 0.3% consensus. It was also a tad higher than January’s 0.3%. That translated to an annual increase of 2.8% vs the 2.7% estimate. It, too, was slightly higher than the previous month’s gauge of 2.7%.

The CPE, which increased 0.3% MoM and 2.5% YoY, matched both monthly and consensus estimates.

Personal Savings grew as personal income exceeded personal spending!

Personal income grew +0.8% M/M, vs the 0.4% estimate, and beat the previous month’s 0.7%. It dwarfed personal spending, which only grew 0.4% MoM, thus allowing the personal savings rate to grow to 4.6% in Feb, V 4.3% in Jan. In a growing or steady inflationary environment that we’ve been seeing for the past years, it becomes exceedingly difficult for the Fed to lower rates when needed, without stoking inflation.

The Strategy For The Rest Of 2025

Coming back full circle, there are far too many negatives to ignore and just ride the AI train, which rewarded me very well for two years, and it would be more prudent to play defense, conserve capital, and raise cash. I think Warren Buffett’s $334 Bn cash hoard is telling us something.

As I mentioned in my last article, two years of 23% sequential gains have happened only 3 times in a century. The chances of a reversal or a stagnant market in 2025 are extremely high; thus, caution would be the biggest objective and strategy.

My portfolio is tech-focused, I’ve been taking profits on tech stocks intermittently, raising cash and diversifying into ETFs, consumer staples, defensives, and also looking at global indices.

Categories
Market Outlook

A Lack Of Consumer Confidence

Market Outlook: Conference Board’s Consumer Confidence Index

Anxiety is rife as Conference Board’s Consumer Survey Drops to a 12-Year Low

A Negative view: The February survey of household sentiment showed that expectations for income, business, and labor-market conditions fell to a jaw-dropping 65.2, a 12-year low. A level below 80 often signals a recession, according to the Conference Board.

And it’s not just forward data – Consumers’ view of the current situation fell to 92.9, V 93.5 expected, down 7.2 MoM, marking four straight months of declines.

Still, there were silver linings, such as the view on labor markets –
33.6% of consumers said jobs were plentiful, no change from the previous month, while 15.7% disagreed, claiming that jobs were hard to get, which was also unchanged from 16% in February.

Inflation remained a major concern, with consumers outlining trade policies and tariffs as root causes.

The Fed balances real-time data with these surveys, as do Wall Street and other analysts, looking for cracks in the economy. So far, nothing has translated into actual reports, which naturally lag these leading indicators. Unfortunately, these turn out to be self-fulfilling prophecies towards a vicious downward cycle unless turned around quickly.

The Fed’s dilemma to balance and maintain the dual mandate of full employment and low inflation continues, as soft data from forward-looking surveys convey anxiety about the economy, data which has yet to show up in current reports such as monthly payrolls, unemployment claims, the JOLTS report, or the GDP numbers. Should these weak surveys show up in the jobs numbers, the Feds would have a hard time justifying rate cuts to goose the economy given stronger and stickier inflation.

Categories
Market Outlook

A Balanced Chair Powell At The FOMC Press Conference

I thought that Chair Powell was impressive at the FOMC March 20th, press conference. He came across as very balanced, cautious, and data-dependent. Clearly, these are not easy with the chaos emanating from the executive branch, and handling an economy that was headed for a soft landing which now may get derailed needs kid gloves.

Chair Powell paid heed to the soft data – forward-looking surveys for inflation and tariffs from sources like the Michigan Consumer Sentiment Index and the PMIs; data that points to softness and uncertainty in the economy borne out of tariffs, deportations, and higher inflation expectations, which all seemed under control just a few months back. He balanced it with what’s showing up as reported, which is nowhere as bad, clearly the surveys are just leading indicators for now.

The Fed’s revised numbers for 2026 are as follows:

  • Inflation 2.8% from 2.5%
  • GDP lower at 1.8% from 2%
  • The Unemployment 4.4% from 4.3%

Given that the softer surveys are not showing up in the reported numbers yet, the proposed strategy is to wait and watch.

When pressed about why he’s going ahead with two rate cuts when clearly inflation is not below the 2% objective, he stressed the Fed’s dual mandate of full employment – which needs cuts in the face of a weakening economy, and tariff uncertainties.

Similarly, he also stressed that the weaker data wasn’t yet showing up in the job numbers, which meant that they were in no hurry to cut, but were ready and willing to act as required. 

I believe the markets heaved a sigh of relief that they haven’t called for more or earlier cuts: I agree with the notion that they’re going to live with higher inflation but not let the economy falter. It is the right way to go. The S&P closed 1.17% higher for the day. At least its moving up from correction territory.

The word transitory came up, a bad penny that’s never left Chair Powell. I understood it as transitory similar to Trump’s first term, in the sense, that they still don’t know the impact. He emphasized that it’s not “transitory” like the mistake they made post-COVID in 2021, and scrambled to raise the rates in 2022. That seems fair.

The bottom line – a lot of ponderables, and moving parts. Clearly, we’ve got our work cut out to make money in 2025! Many have never seen a stagflationary environment and to be sure it is going to be tough navigating it.

In the shorter term, I would expect the S&P 500 to rise a bit more, there is the 200DMA hovering at 5,705, which is a key resistance level – hopefully, we clear that before the PCE next week.

Categories
Market Outlook

Slumping Consumer Confidence Doesn’t Bode Well For The Market

Market Outlook – Consumer Confidence

Consumer confidence slumps more than consensus in February, with the index coming in at 98.3 vs. 103.0 consensus and 105.3 in January (revised from 104.1), according to data released by The Conference Board this morning,

The drop was severe, and the most since August 2021 on concerns about the outlook for the broader economy – uncertainty over the Trump administration’s policies weighing on households. 

I had posted on Friday, stating that a plethora of weaker economic indicators was likely to lead to a drop in the market and this one added to the market’s woes, which at writing was down about 1% to 5,940 – some 3% lower than its high of 6,147.

The Conference Board’s gauge of confidence decreased by 7 points in February to 98.3, the third straight decline.

The expectations index ( 6 months) sank 9.3 points to 72.9, the most in three-and-a-half years, while a gauge of present conditions declined more modestly 3.4 points to 136.5

Recession woes and worsening outlook: The drop in confidence was broad across age groups and incomes, with consumers more pessimistic about current and future labor-market conditions, as well as the outlook for incomes and business conditions. The DOGE cuts are not helping confidence for sure.

The consumer board report, didn’t mince words about the severity of the decline.

“In February, consumer confidence registered the largest monthly decline since August 2021,” said Stephanie Guichard, Senior Economist, Global Indicators at The Conference Board. “This is the third consecutive month on month decline, bringing the Index to the bottom of the range that has prevailed since 2022. Of the five components of the Index, only consumers’ assessment of present business conditions improved, albeit slightly. Views of current labor market conditions weakened. Consumers became pessimistic about future business conditions and less optimistic about future income. Pessimism about future employment prospects worsened and reached a ten-month high.”

The dreaded R-word, which had been buried under the AI boom resurfaced, – the share of respondents expecting a recession in the next year rose to a nine-month high.

Tuesday’s report reinforces other surveys that I had cited, showing a doubtful and hesitant populace, waning after an initial surge of animal spirits post-election. Tariffs and higher prices dominate the conversation, as they did in the Michigan sentiment survey,  as inflation pressures pick up again and the labor market suddenly looks shaky. One would wonder if the DOGE leadership thought through their actions and the effects on the economy with all the government layoffs. Clearly, the mood seems to have soured.

I continue to be extremely cautious, and will only buy exceptional bargains, I believe the S&P 500 could correct to 5,780 – the pre-election level, after which I would re assess the market before entering again.

Categories
Market Outlook

Market Outlook –  Economic Indicators Suggest A Possible Correction

There has been a spate of economic indicators in the past week or so, which are bearish for the market indicating a possible correction or at the very least a level of caution.

Let’s take a look.

The PMI – The Purchasing Manager’s Index – a 17 Month Low!

S&P Global released its Flash US PMI Composite Output Index, which measures activity in the manufacturing and services sectors. 

The index fell to a 17-month low at 50.4 in February, down from 52.7 in January, indicating that activity had slowed to a virtual standstill. Worse, cost inflation accelerated even with the lower activity, and was absorbed by suppliers who were unable to pass it on – indicating a possible stagflationary spiral.

Economists didn’t see it coming with expectations of 53.

What were the main causes?

From Trading Economics, emphasis mine:

It also marked the slowest pace of business expansion since September 2023, driven by a renewed contraction in services output that partially offset faster manufacturing growth. New order growth weakened significantly, while employment edged lower amid rising uncertainty and cost concerns. On the price front, input cost inflation accelerated to its highest level since last September, while selling prices saw their slowest increase in three months. Finally, business optimism about the coming year slumped to its lowest since December 2022, except for last September, amid concerns over federal government policies related to domestic spending cuts and tariffs, as well as worries over higher prices, and broader geopolitical developments. 

Source: S&P Global

The University of Michigan Sentiment Index

The University of Michigan’s consumer sentiment index fell to 64.7 in February from 71.7 in January. Economists polled by FactSet were expecting a much better 67.5. 

Year-ahead inflation expectations rose to 4.3% from 3.3% in January. This is a worrying sign, high inflation expectations hurt the mass consumer and spending.

Tariffs are scaring consumers as all five index components weakened this month, with durables lower by 19% mostly on ears that tariff-induced price increases were imminent.

From the University of Michigan website:

Year-ahead inflation expectations jumped up from 3.3% last month to 4.3% this month, the highest reading since November 2023 and marking two consecutive months of unusually large increases.

Current Conditions Index: 65.7 vs. 68.7 expected and 75.1 January.

Consumer Expectations Index: 64.0 vs. 67.3 consensus and 69.5 prior.

Housing:

January was no exception, continuing the trend of the past two years, which saw high mortgage rates decimating housing, U.S. existing-home sales declined 4.9% in January from the prior month:

According to the Wall Street Journal,

Existing home sales of 4.08Mn also came in below expectations at 4.11Mn.. Economists surveyed by The Wall Street Journal had estimated a monthly decrease of 2.6%. In 2024, home sales fell to the lowest level since 1995 for the second straight year.

First-time home buyers seemed to be priced out by the double whammy of higher prices and high mortgage rates. I had reported earlier that the brave home buyers from 2022-2024 would feel the pinch of not getting to re-finance their 6-7% mortgage and clearly, few takers are willing to take that risk now.

Cash is at a record low:

According to the BOFA Global Fund Manager survey, cash is at 3.5% – the lowest level since 2010!

That begs the obvious question? With only 3.5% cash what’s left to buy the dip? With over-ownership of the M-7, these stocks aren’t just overbought, a) There’s previous little cash left to buy when the prices get attractive and b) You already own all of them, where’s the room to add more?

Goldman Sachs is advising caution:

Scott Rubner from Goldman believes that the “Buy The Dip” could fade:

We could be in a fading, twilight of a bull run and headed for a correction according to Scott Rubner, managing director for global markets and tactical specialist at Goldman Sachs.

Rubner was categorical in stating the good times from corporate buybacks, retail investors jumping in on every dip, 401k inflows, and beginning of the year investing was waning, and once the corporate buyback period went into the quiet period for Q2, fund flows would move away from equities.

According to Rubner:

“My highest conviction is that this massive ability to buy dip alpha is starting to wane.” Rubner also said that hedge funds have allocated a lot of risk back into the market. Global equities saw the largest net buying in two months last week.

Rubner backed his findings with two key statistics; His assessment that computerized trading desks selling triggers, in the event of a market dip would unload $62Bn worth of equities compared to just $9.55Bn of buying on buying signals – pretty asymmetric towards the downside. Secondly, he also cited “A net retail buy imbalance for the last 22 days, including the top three largest days on record, he said. “This cohort is happy to buy any 2-3% dips for now.”

Q4-24 Earnings weren’t good enough:

The FactSet report on S&P 500 Earnings on 02/14 was just average and for this market to keep rising average won’t do – the valuations The M-7, bellwethers were also sluggish and will have a hard time taking the indices higher.

And while I’m positive about AI, semiconductors, and several fundamentally strong tech companies, valuations have been stretched for a while, thus it would be prudent to take advantage of some of the prices by booking profits, which I have started and posted in the trade alerts section.

While a set of economic indicators doesn’t necessarily doom the market, the downside surprise indicates that we’re not paying enough attention to economic weaknesses, against a backdrop of stretched valuations and interest rates that refuse to fall. The correct de-risking strategy would be to sell and keep cash available for better bargains.

Categories
Market Outlook

How To Thread The Needle In A Choppy Market In 2025

  • Stubborn inflation and the fear of inflationary policies such as tariffs, budget deficits, and deportations had led to high 10-year treasury yields jumping to 4.8% before dropping to 4.66% today.
  • This, in turn, has spooked the S&P 500, which gave up its entire post-election bounce before bouncing back today.
  • The S&P 500’s current yield of 4.6% is less attractive compared to the 10-year treasury yield of 4.66%, questioning the risk-reward balance.
  • However, while the 4.66% yield will compete for investors’ funds, patient investors who can stomach a correction should do much better scooping up high-quality bargains.
  • There are enough positives to come from the new administration, such as lower taxes, less regulation, and business-friendly policies, which will trump the negative of high interest rates.

Will 10-year treasury yields of 4.66% drag down the market?

The equity risk premium

The current yield for the S&P 500 (NYSEARCA:SPY) is 4.6% or the 2025 Consensus Bottoms Up EPS of $274/S&P 500 of 5,953 = 4.6%. Comparatively, the 10-year treasury yield stands at 4.66% The commonsense argument is that if the US treasury gives me a risk-free return of 4.66% why should I make a risky equity index investment, yielding even less at 4.6%?

Risk-averse and conservative investors usually require a risk premium to invest in equities. During the great deflationary period from 2009, after the Great Financial Crisis, to Feb. 2020 (pre-pandemic), the equity premium was quite large as shown below. The average yield premium was 2.79%, and it rarely fell below 2%. The 10-year yield averaged 2.43%.

Source:Fountainhead, Yahoo Finance

In an inflationary environment, with the 10-year at 4.66%, we’re getting a discount of 6 basis points or 0.06%, which begs the question

a) Either I should get a premium return for that risk or

b) I should pay less to increase my yield.

Stubborn inflation

With stubborn inflation, a reduction in yields looks unlikely, and many would patiently wait for the reduction in the index to get in at a decent price. Not surprisingly, as of Jan. 14th, we’ve given back almost all the Trump bump, falling to 5,800, a mere 0.5% from the Nov 5th election date close of 5,782, which has now bounced back to 5,953 following the better-than-expected CPI report.

Last September, I was confident that the Fed’s reduction of 0.5% would lead to a 10-year closing between 3.25% and 3.5% in 2025. At an earnings yield of 4.6%, that would have been a fairly decent premium of around 1.25%. Initially, it did drop to 3.6%; however, given sticky inflation readings in the next 3 months and a stronger-than-expected job market and economy, 10-year yields have gone the opposite way climbing to 4.79%, before dropping to 4.66% — leading to the Feds anticipating just two cuts in 2025 in their dot plot from the December 18th FOMC meeting. Four weeks later, the markets have taken a step further, anticipating just a paltry 27 basis points reduction in 2025.

This morning, on Jan. 15th, the CPI report was much better than expected, with core CPI coming in only 0.2% higher from a month earlier, – a drop after increasing 0.3% in each of the previous four months. Its YoY increase was only 3.2%, lower than 3.3% in November and below the 3.3% consensus.

The 10-year yield dropped to 4.66% – a huge 13 basis point drop, leading to a 1.7% increase in the S&P 500 by mid-afternoon to 5,5953.

The Fed’s December meeting minutes also revealed a Fed that was worried about higher inflation from the incoming administration’s tax and tariff policies, which contributed to their forecast of only 2 cuts in 2025. From the FOMC minutes:

Almost all participants judged that upside risks to the inflation outlook had increased.

The S&P 500 (SP500) dropped 1% on January 7th, when PMI data revealed persistent price increases on the services front. It dropped another 1.5% with the massive 256,000 gain in net new jobs created, with the non-farm payrolls released on January 10th. Price action in the treasury clearly confirms this worry and, given how fast traders have sold bonds, suggests that this could well continue. Market headlines blaming the weakness in stocks on bond yields have only increased. Simply, the markets are sanguine until they’re not, and then the dam breaks.

The incoming administration’s volatility premium

I also believe that traders are assigning a “volatility” or even a “drama” premium if you will. Markets hate uncertainty. If you’re a bond manager already facing three years out of the last four of losses, witnessing the bizarre behavior of our elected officials towards the end of the year of getting a simple budget extension is going to weigh on your decisions. Why buy the treasury at 4.79% when the yield could shoot through 5.5% if there is more drama getting anything done in Washington with a razor-thin majority and an executive branch executing through Twitter?

An emboldened Trump, with a penchant for implausible actions such as annexing Greenland and the Panama Canal, will only increase bond market jitters.

High interest rates hurt Main Street, not just the market

The other factor that worries me about rising interest rates is the higher interest burden on other sectors such as commercial real estate lending, and residential mortgages. Residential mortgage rates are over 7% now, and while over 92% of residential mortgages are at much lower fixed rates, I would think that a significant amount of home purchases (some of which were chasing high-priced homes in short supply due to inventory shortages) have been made at higher mortgage rates in the last two-three years with the hope that they could refinance at cheaper rates – and clearly that hasn’t happened in 2023, and 2024 and from the looks of it, very unlikely to happen in 2025.

Similarly, the commercial real estate market is also likely to face problems.

According to Trepp estimates, roughly $1.7 trillion, or nearly 30% of outstanding debt, is expected to mature from 2024 to 2026. This is commonly referred to as the “maturity wall.” CRE debt relies heavily on refinancing; therefore, most of this debt is going to need to be repriced during this time.

The 4.5% yield threshold

Source: The 4.5% yield threshold (Bloomberg, FactSet, Morgan Stanley Research, The Heisenberg Report)

Last April the S&P 500 P/E fell in tandem with the 10-year rise, and it currently looks to be following the same path, not auguring well for the market in 2025.

Could we get “Trussed”?

UK 10-year bond yields surged by 30 basis points on January 8th, to 4.925%, bringing back bad memories of the harrowing 49 days of Elizabeth Truss’s short-lived premiership in 2022.

Back then, Truss had made the mistake of unveiling an unfunded budget of 45Bn GBP of tax cuts when inflation rates were about 11%! UK Equity, Bond, and Currency markets sank, with many even suggesting that the UK government’s treasury was no better than that of a Third World country. Almost destroying a weak Gilt market ultimately led to her resignation.

Fast-forward to 2025 – the 30 basis point drop to a level not seen since 2008 has 2 repercussions. 1) Bond markets are reacting very strongly to governments not having enough control over their country’s inflation. Punishment was swift and severe. It was the 4th day of drops in the UK bond market.

2) The second repercussion, and what worries me; is this going to happen in the US market as well as the incoming administration starts working on their planned tariff hikes, which will increase inflation; if so, where does the yield stop?

Tax cuts can be inflationary

Trump’s proposed tax cuts reduce tax revenues and increase deficits, which is inflationary.

The incoming administration plans to extend the 2017 tax reductions, reduce the corporate tax rate, and decrease or eliminate taxes on certain types of income. Here is the analysis from taxfoundation.org:

Using the Tax Foundation’s General Equilibrium Model, we estimate Trump’s tax proposals would increase long-run GDP by 0.8 percent, the capital stock by 1.7 percent, wages by 0.8 percent, and employment by 597,000 full-time equivalent jobs.”

“We estimate the proposals would increase the 10-year budget deficit by $3 trillion conventionally and $2.5 trillion dynamically. The debt-to-GDP ratio would increase from its long-run projected level of 201.2 percent to 223.1 percent on a conventional basis and 217 percent on a dynamic basis. Increased deficits and a higher debt load would require higher interest payments on the debt that would reduce American incomes as measured by GNP by almost 0.8 percent; the higher interest payments drive a wedge between the long-run effect on output of 0.8 percent and the long-run effect on GNP of -0.1 percent.

As you can see above, the repercussions can be good for the economy with higher GDP, but it will also be inflationary and expensive to service with higher interest rates. What’s also significant is that the administration believes that they can make up the shortfall by increasing tariffs, which in my opinion will worsen an already high inflation rate.

What the bulls say: There are a lot of positive factors as well

Juxtaposed with the negativity of high interest rates are the positive effects of excellent earnings growth from the S&P 500, lower taxes, and less regulation.

Source: S&P 500 Earnings (FactSet)

FactSet’s estimates call for a strong 14.64% growth in the S&P 500 for 2025 to 274.19, followed by 13.6% growth to 311.44 in 2025. In the years that I’ve been using FactSet, I’ve seen that the variation is not significant for the index. I strongly believe that the S&P 500 earnings would come in between 267 and 281, with an error margin of just 2.5%. But the problem is not in the performance – it’s the valuation, we’re priced to perfection as seen below, and disappointments could be the main catalyst for a drop.

Source: S&P 500 P/E Ratios (The Heisenberg Report, Datastream)

The last time the S&P 500 P/E was above 20, the 10-year was around 2%, currently, we’re at a P/E of over 21.73, but the 10-year is at 4.66%.

Corporate Debt is doing fine

Credit default risk is low among corporate borrowers as per a Goldman Sachs report.

Good earnings and cash flow over the last few years have led to low debts on several investment grade and lower balance sheets. The level of fallen angels – or companies below investment grade, is at its lowest level in 25 years.

Risk premiums are not mandatory for equity investments

The lack of an equity risk premium is not the end of the world and as we can see from the chart below, in higher interest rate environments from 1985 to 2000, there never was one. The biggest premiums have been in the deflationary era, post the GFC from 2009 before the Fed started raising interest rates to quell inflation.

Source: Equity Risk Premium (Fountainhead, Yahoo Finance)

A high interest rate doesn’t kill the equity market just because of a lack of a risk premium, but it provides competing offerings at much lower risk, and we saw that hurt the equity market in 2022 when the Fed started raising interest rates aggressively to contain inflation. I, myself, put money in high-yield CDs and corporate bonds through 2023.

A 5% Treasury yield should attract buyers

I believe there could be a lot of buying if the treasury breaches 5%. In October 2023, when the Middle East conflict was raging, bond yields briefly touched 5% from where they reversed very steeply, on buying and a subtle push from Treasury Secretary Janet Yellen, who reduced the size of government auctions by $76Bn. Will history be repeated? I think it’s likely that there will be substantial buying of 5% treasury bonds, as do several analysts, and money managers.

Inflation: The worst is likely behind us

The PPI came in a little lower than expected at 0.2% M/M in December 2024, versus a consensus of +0.4% and November’s reading of +0.4%. Even better, the core PPI was flat M/M, significantly lower than the expected rise of 0.3%. The benign numbers triggered a relief rally on Jan. 14th, and the CPI report which came in today (Jan 15th, 2025), did even better with the core CPI beating estimates, leading to a drop of 13 basis points in the 10-year and a huge 1.7% gain in the S&P 500. This could be the beginning of a trend reversal.

Positive effects of lower taxes

Even as we move towards a more inflationary environment with unfunded tax cuts, the Tax Foundation believes that lower taxes would increase long-run GDP by 0.8 percent, capital stock by 1.7 percent, wages by 0.8 percent, and employment by 597,000 full-time equivalent jobs.

Rekindled animal spirits are great for Main Street

Small businesses, which are major employers and contributors to US GDP, are very optimistic about the Trump administration’s policies, which should augur well for the economy. Small businesses are notably excited about higher sales, less regulation, increased chances of finding high-quality labor, stabilizing inflation or price increases, and importantly, better credit conditions due to less regulation. Not surprisingly, the groups’ uncertainty indicator has dropped as well.

What is the best way forward to invest in a difficult year?

Keep realistic expectations

There are enough bullish and bearish factors without either one having a clear edge. In 2023, the S&P had a reasonable P/E of around 18, allowing the big AI bang from Nvidia’s May earnings report, to propel the index to a 24% gain. In 2024, the S&P 500 gained 23% as the AI trend continued, but now inflation has persisted and the S&P trades at an expensive 21.7 times 2025 forward earnings. The chances of a third year of 20% gains are rare; it’s happened only 3 times in the past 100 years, but two of those were in 1935, and 1936 following the great depression, and then the third one in the nineties during the dot-com bubble. So, my expectations have to be very realistic.

Wait for bargains

The correction should continue, which allows us to scoop up bargains: In my opinion, we’re likely to see 5,500 before 6,500 in 2025. The S&P had wiped out the post-election bump, dropping to 5,800, past the 20 and 50 DMAs, before reversing this morning. Should it drop again, I expect strong support around its 200 DMA of 5,582.

Besides, I think this market will continue to correct until interest rates stabilize, which won’t happen until we see a drop in PCE readings (due at the end of January) wage growth, and a reduction in volatility, which is high with the VIX hovering between 17 and 19. There’s also precious little one can do about volatility; this is a Presidential stock-in-trade. The first few weeks of the Trump administration should be fairly volatile, as they roll out their tariff, deportation, and tax plans. The incoming President has stated that they intend to get off the ground very quickly with executive orders on day one, with immigration a big priority, which means we should get a fairly good view of deportations and their inflationary effects. The Trump administration also showed in their previous innings, firing unrealistic salvos as opening bids – and thus I assume a zero chance of 60% tariffs – the realistic number is likely to be much lower, but the drama will unsettle the market.

Focus on the big picture and stick to the fundamentals

To me, the biggest investment factor is always the fundamentals of great companies, which trumps macro, economic, or technical factors in the long run, unless they’ve historically deviated from the norm, and we’re not anywhere close to that. The stellar jobs report for December confirms how strong the economy is, in fact, higher wages are your biggest defense against inflation – good news is good news. It’s idiotic to hope that the labor market weakens, so the Fed can cut rates – very twisted logic, which hopes for weakness in the economy!

Earnings

Earnings will continue to do well, as we saw from FactSet’s estimates and especially across the M-7; No matter how much we complain about the lack of breadth, the M-7 will still carry the economy and the markets. The M-7 are not outliers, they are truly entrenched in the economy and are in the rare, sweet spot of being secular and sustainable growers and stalwarts with strong brands, pricing power, and huge moats.

Stocks to buy on declines

Taiwan Semiconductor Manufacturing Company Limited (TSM) – I first recommended TSMC in August 2023, and continue to add on declines. Its December monthly revenue grew 58% YoY and fourth quarter revenue grew 39% YoY, suggesting a strong beat of its mid-point guidance, and confirming its strength as one of the strongest pillars of the semiconductor industry.

NVIDIA Corporation (NVDA) – The CES showcased a strong Nvidia with its foray into the PC market, its new gaming chips, and the introduction of Cosmos, which takes its Ominverse segment to much higher levels with the addition of Blackwell architecture. Any short-term thinking about Blackwell delivery delays is just noise and a great opportunity. I’ve started buying around $132 and will continue to add on declines. I’ve owned Nvidia for a long time and have recommended it in March 2023, and July 2023.

Alphabet Inc. (GOOG) (GOOGL) does not get enough recognition for its market leadership and moats in Search, YouTube, Google Cloud, and Waymo, with far too much focus on the antitrust ruling. Given the new administration’s anti-regulatory stance, I don’t believe Alphabet will be hurt as badly, and even in the worst case, here’s a sum of the parts valuation, which at $2.6Tr is higher than its current market value of $2.35Tr.

I would also add the following on declines: Duolingo, Inc. (DUOL), the market leader in language learning and a huge beneficiary of AI, Marvell Technology, Inc. (MRVL), which has a strong position in ASICs and is very attractive at 12 times sales growing at 40%, and 41 times earnings growing at 33%,

Corrections are healthy for the market, and I look forward to buying on declines.

Categories
Market Outlook

Bond And Stock Markets Rally Strongly On Cooling Inflation

Bonds Rally: The US 10-year treasury yield drops 14 basis points from 4.8% to 4.66%

The S&P 500 rallies 1.83% to 5,950, and the Nasdaq Composite zooms 2.45% to 19,511

CPI Data Signals Cooling Inflation in Good News for Fed

US Dec. consumer prices rise 0.4% M/M; Est. +0.4% The broader Consumer Price Index (CPI) matched expectations and rose 2.9% in December from a year earlier.

The benign numbers were in the Core CPI, led by shelter inflation, which was sorely needed.

Core prices rose 0.2% in December, less than the 0.4% estimated and 3.2% from a year earlier, down from 3.3% in November – an unexpected decline, which sparked the bond and stock rally.

Prices for shelter, airfares, used cars and trucks posted gains. Airfares were the outlier rising by 7% and gas prices also rose 4% MoM

Shelter inflation remained moderate, coming in at 0.3% on the month, a big sigh of relief for the Feds – shelter inflation is the stickiest and the hardest to reduce. The shelter index rose 4.6% YoY,  the smallest annual increase since January 2022.

US government bonds rallied strongly, reviving hopes of additional Federal Reserve interest-rate cuts, which were down to a total 29 basis points cut for the whole year. 

As the rally progressed Treasury yields across maturities fell by at least 10 basis points and closed with 10-year yields falling as much as 15 basis points to 4.65% for its biggest daily decline since August.

What a turbulent month so far – and all this before Trump is sworn in. The drop in yields reversed the sharp rise from a strong December employment data released Friday, which sparked a surge toward the highest levels in months to 4.81%, all but confirming that the Feds may not cut rates at all this year. At 4.81%, the 10-Year was a 100 basis points higher than when the Fed began easing in September.

Categories
Market Outlook

A Flicker Of Hope After The Fed Flameout

12/20/2024

The Fed’s favored inflation gauge – core PCE – cools slightly in November

The core PCE Price Index, the Federal Reserve’s preferred inflation measure, edged up 0.1% M/M in November, less than the +0.2% consensus and cooling from the +0.3% pace in October. Personal income and spending also came in slightly lower than expected in the month.

On a year-over-year basis, core PCE increased 2.8%, just under the 2.9% consensus, and running at the same pace as in October.

PCE Price Index, which includes food and energy, also ticked up 0.1% M/M vs. +0.2% consensus and +0.2% prior.

That measure translated to a 2.4% Y/Y increase, less than the +2.5% consensus, but slightly hotter than the 2.3% rise in October.

Personal income: +0.3% M/M vs. +0.4% expected and +0.6% prior.

Personal outlays: +0.4% M/M vs. +0.5% consensus and +0.4% prior.

At the time of writing, premarket S&P 500 Futures are down 0.6% after being down 1.5% overnight after the second stop-gap funding bill failed miserably to get through the House of Representatives.

Categories
Market Outlook

Don’t Ignore The 10-Year Yield

The likelihood of only two Fed rate cuts in 2025 sent the markets tumbling yesterday, even as Chair Powell was still answering pointed questions about the resilience of the economy and where inflation was headed in 2025. The S&P 500 eventually closed 2.96% lower. shattering the post-election rally.

The markets had been ignoring the 10-year yield for far too long. The 10-year went from 3.6% in September when the Fed started cutting to 4.40% before the FOMC meeting, signaling that inflation wasn’t completely done and that stock valuations were getting frothy. It unraveled yesterday. Analysts are talking about the 10-year possibly reaching 5%, which will remain bad for stock multiples. The S&P 500 and the Nasdaq Comp are down 4.5% from their highs. Let’s see how the PCE report is on Friday.

The last time the S&P 500’s P/E ratio was 22, it was 2021, and the 10-year treasury yield was 1%! We are at 4.5% and climbing! The expectations of 4 cuts in 2025 had kept the markets hopeful that the 10-year would follow suit and head back below 4%. Clearly, that’s not happening. Either the index has to come down or the 10-year has to drop to justify these valuations….

Also don’t forget the Fed’s reluctance to cut big for forecast more cuts in 2025 was based on the Sep, Oct and Nov inflation readings, they’ve not even talked about the possible inflationary impact of tariffs and larger fiscal deficits – somebody has to fund the government when they’re not collecting enough taxes, and the weaknesses in the past two treasury auctions suggest that lenders are demanding better rates to lend to the government.

Categories
Market Outlook

A Hawkish Cut

12/17/2024

A Hawkish Cut

As expected the Fed cut interest rates by 0.25% bringing the Fed Funds rate to 4.25% to 4.5% To be sure, this is a hawkish cut. The S&P 500 gave up its gains of 0.5% and has dropped 1.5% in a reversal as has the Nasdaq Composite, down a full 2% to 19,703.

The 10-year treasury yield has shot to 4.5%, a harbinger of how the markets believe that the Feds will have to pay more to finance the deficit, with analysts even talking of 5% – a rate seen last October.

The hawkishness stems from the FOMC Median 2025 PCE Inflation Forecast, which rises to 2.5% vs 2.1%

The median forecast of Fed policymakers for the benchmark rate for the end of next year is now 3.9%. That compares with 3.4% back in September. That suggests 50 basis points of easing compared with 100 basis points in September (including the impact of today’s rate cut).

Today’s cut means policymakers have now lowered their benchmark lending rate by a full percentage point since mid-September. The median estimate of Fed officials now sees just two cuts next year. Most folks were expecting three in the forecast.

Fed officials are tipping an unemployment rate of 4.3% next year a shade higher than the current 4.2%. Chair Powell in the conference that followed stressed that he wanted to ensure that labor markets didn’t get derailed when asked about the need to cut.

The Fed’s policy statement also alluded to a slower pace of cuts by saying “the extent and timing” of additional adjustments would depend on the outlook. This too was stressed in the conference that it would always be new data that would matter.

The neutral rate discussed (the rate at which the economy is neither inflationary nor disinflationary) is now 3%, higher than the original 2%, which the Feds were hoping to achieve by 2024, now highly unlikely before 2027.

Given the strength in the economy, with the GDP at 2.8% and projected to grow above 2% next year, a strong labor market with an unemployment rate of only 4.2%, this is not a bad call and regardless of how the market reacted, the caution to cut slower in 2025 is warranted in my opinion.