Fountainheadinvesting

Categories
Market Outlook

March Core PCE Price Index Matches Expectations, While Personal Income and Outlays Show Steady Growth

March Core PCE Price Index:

+0.3% M/M vs. +0.3% consensus and +0.3% prior.

+2.8% Y/Y vs. +2.7% consensus and +2.8% prior.

PCE Price Index: +0.3% M/M vs. +0.3% expected and +0.3% prior.

+2.7% Y/Y vs. +2.6% expected and +2.5% prior.

Personal income: +0.5% M/M vs. +0.5% expected and +0.3% prior.

Personal outlays: +0.8% M/M vs. +0.6% consensus and +0.8% prior.

The 10-year is down slightly to 4.67%

Categories
Market Outlook

Manufacturing PMI Signals Weakness: What It Means for the Economy and Markets

The weaker manufacturing sector is a much smaller part of the economy than services. Manufacturing PMI seems to suggest that economic growth and inflation are not as strong as feared – especially if payroll declines are true to this estimate at least. This is not a major surprise, but the weakness in the service index shows that services is seeing a spillover. This should be watched carefully.

The markets have reacted positively, following yesterday’s bounce back – up ¾ to 1%. (Bad news is good news!)

Tesla reports today, likely to be bad but may be discounted.

Meta reports tomorrow after the market, I’ll put up the preview numbers.

Microsoft and Google report on Thursday.

To round off the week we have the PCE number on Friday, which should give us a better idea of inflation – that is the Fed’s preferred gauge.

Categories
Market Outlook

Market Analysis: S&P 500’s Recent Decline and Interest Rate Implications

S&P 500 5,022 down 243 points, 4.6% from its all-time high of 5,265.

10-Year US Treasury 4.6%, possibly breaching its Oct 2023 high of 4.98%

There has been a lot of consternation regarding the market in the last two weeks, with the index dropping almost 5% and the 10-year jumping from 4.25 to a high of 4.67% because of the fear of higher for longer interest rates due to stubborn inflation and the reluctance of the Fed to cut rates till they put the inflation genie back in the bottle for good.

Let’s look at it chronologically from Oct 2023.

In late October 2023, when the 10-year was close to breaching 5% Janet Yellen signaled lower interest rates by borrowing $76Bn less than anticipated for the last quarter of 2023.  A nod to the nasty run-up in rates, which if unfettered could have been harmful to the economy. The Feds had stopped raising interest rates after the last quarter-point raise in July, and by October, the consensus viewpoint was developing that the markets had done the Fed’s work with the 10-year treasury circling 5%. 

Around the same time, multiple Fed officials had said rising Treasury yields are indicative that financial conditions are tightening, possibly making additional rate hikes unnecessary, when the 10-year Treasury yield topped 4.9% on Wednesday, a first since 2007. During this run-up in interest rates, the S&P 500 had dropped to 4,120 from its July high of 4,560.

Once the 10-year treasury topped out, and Q3 2023 earnings season also exceeded expectations it set up the S&P 500 for a furious run up from the October low of 4,120 to about 4,800 by Dec 2023. A massive gain of almost 700 points or about 17%! helped by the Dec dot plot indicating possibly 3 cuts in 2024

We had another positive run in Q1, to the all-time high of 5,265 – both on AI-related earnings and expectations of the 3 cuts materializing in 2024.

My takeaways

  • A drop of 4.6% compared to the rise from 4,120 in October to 5,265 (28%) is an overdue correction, not a reason to panic.
  • The earnings yield of the S&P 500 = $245/5,022 = 4.9%, which is just above the 10-year treasury yield of 4.6% – we’re getting just 0.3% higher for a riskier investment compared to a risk-free investment of a government security. That’s a very small risk premium, I would think the S&P 500 is likely to fall further to see some semblance of the historic and mean premium of at least 1 to 1.5%.
  • The same argument that the Fed used in October is likely to happen as the treasury inches towards 5% – 
  • a) the market itself has made financial conditions worse, (done the Fed’s work – a 0.6% rise in the treasury is more than 2 quarter-point hikes!) 
  • b) Buying a risk-free (US Government) long-duration bond paying 5% is a damn good yield and when funds start buying bonds, the yields fall. There will be buyers from all over the world for that kind of yield. Especially in the event of further turmoil in the Middle East – that’s the flight to quality and safety. I don’t see yields topping 5% – I would be shocked if it did.
  • The Vix (Volatility Index) or the fear gauge as it is known has shot up to 18-19, after being dormant to steady in the 12 to 14 range through Q1-2024. Computerized trading desks or CTA’s, trade based on volatility which will cause sudden drops and a lot of choppiness, which scares investors. Zero-day options are not helping either. For example, if I see a 1% down day, my first reaction is to lower my buying limits.
  • Earnings season should be good, but misses are likely to be hammered disproportionately given the weakness in the market. Semiconductor monopoly ASML, which missed bookings but assured the same full-year guidance and a great 2025, dropped 8% today.
  • The graph below is a good contrarian indicator and makes me shake my head at supposedly professional investors. Fund managers have record low cash levels – they’re overextended at only 4.2% cash. When they need the money to pick up bargains, they don’t have it! Some professionals! This won’t help the market recover easily.
  • This is another good chart.

If Q1 has risen more than 10%, on every occasion except 1987 (the year of the Black Monday crash) it has closed the year higher. That doesn’t preclude drawdowns and the average pullback in the years was 11%, with a low of 3%.

  • I feel the best way to play this uncertainty is patience and lower limits – the first quarter was exceptional and unlikely to be replicated. 

 THE LONG-TERM STORY FOR QUALITY STOCKS IS VERY MUCH INTACT, but we would be better off getting good prices. The first to recover will be the high-level quality stocks – see how steady Microsoft is compared to the rest. 

  • In the last 15 days, my buy trades and recommendations have been limited as you may have noticed and strictly averaging lower with lower limits. I intend to keep it that way.
Categories
Market Outlook

CPI inflation stays hot in March

CPI inflation stays hot in March

  • March Consumer Price Index: +0.4% vs. +0.3% expected and +0.4% prior.
  • +3.5% Y/Y vs. +3.5% expected and +3.2% prior.
  • Core CPI: +0.4% vs. +0.3% expected and +0.4% prior.
  • +3.8% Y/Y vs. +3.7% expected and +3.8% prior.
  • That translates to a 3.8% increase over the past 12 months, topping the 3.7% increase expected and keeping the same pace as in February, the U.S. Department of Labor said.
  • Shelter and gas combined contributed over half of the overall monthly increase.
  • Treasury 10-year yields rose 10 basis points to around 4.45%, 

The S&P 500 Futures are down 1.45%

Categories
Market Outlook

The Macro Approach And Historic Valuations;. Are We Overpriced?

Top down-market strategy is relevant and sometimes essential when you want to compare the S&P 500 against historical benchmarks. I did this in a series of articles for Seeking Alpha from Dec 2022 to June 2023 and spoke about the same things that market outlook strategists do – historical valuations, poor market breadth, interest rate correlations, smaller categories dominating, and future earnings being misleading especially when they start to falter. I still pretty much look at the macro backdrop every week even now, but it’s a great backdrop, an important framework and benchmark but not a primary factor or thesis for making individual stock decisions. I stopped doing the market outlook top-down series a while ago, when I realized I should get back to my roots and focus on fundamentals getting into the weeds, rather than trying to get better returns by forecasting market direction. As an example, in April-June 2023, I was trying to predict a 3-5 % correction in the S&P 500 when the AI revolution was happening in companies like Microsoft and Nvidia right before my eyes, again ironic because my first article recommending Nvidia was in October 2022.

And that’s been the story for the better part of 3 decades – more success in fundamentals than macro/market direction and technical analysis.

There are several bearish top down-market prognosticators talking about the overpricing of the current market with equally good rebuttals from the bull camp – the correlation with the Nifty Fifty gets the most pushback as does with the 1999 internet bust. There is the concern about poor market breadth with tech stocks hogging too much of market cap and profits, with the rebuttal being the GFC peak. In the 2007-2008 Great Financial Crisis bust, the financial sector had the highest concentration of the S&P 500; financials are typically cyclical with P/E’s rarely exceeding 12-14, and then they were at 20, with expectations of 25% growth, their debt-to-equity ratios were like 33:1 That was an example of ABSURD overpricing! 

The point is – it is extremely difficult to compare and predict the bull market euphoria peaks, and to a great extent that time is better spent getting into the weeds of individual stocks and also using the macro backdrop as a variable but not the prime one. Also, how are we going to make better returns trying to time the S&P 500, through downturns or predicting bubbles?

A great company bought at a good price will also go through a drop when the market turns bad – sometimes only because the sentiment has turned and more often on its own demerits and reduction in earnings power, often we’ve overpaid or not taken profits when the going was good. There is no escaping the inevitable downturn, and we try our best to mitigate it. Profit taking is important, not chasing momentum is important; Not overpaying is equally important. Buying quality companies is very, very important. Diversification is important, I do want to have less tech or AI stocks and am always looking out for good ones in other sectors, without getting into value traps just because they’re cheap. There are a bunch of strategists who’re advising buying the Russell 2000 as a de-risking strategy because the gap between the valuations of the Russell 2000 and the Nasdaq 100 is the widest in decades. There is some merit in that, but de-risking is a strange way to put it, because by definition the Russell 2000 has the biggest loss making stocks with the highest earnings risk, and the highest weighting in it is the overpriced SuperMicro (SMCI)!

In terms of macro strategy, I like using the FactSet S&P 500 monthly earnings report, which I follow for the broader Price/ Earnings multiple, earnings and earnings growth. In my opinion, the market is overpriced by about 10% for sure, the last decade’s P/E ratio was about 18-19, we’re at 21 now, with the Index at 5,100 / $245 earning per share. 

If you look at the earnings yield of the S&P 500 it is $245 per share / index of 5,100 = 4.8%. The first question you would ask is why am I investing in the market when the 10-year risk free treasury gives me 4.4%, what, am I getting only 0.4% extra for the extra risk?? The historical risk premium in the last two decades has been closer to 1.5%. Even though I ran the numbers from 1962 the other decades have their own idiosyncratic reasons and are not comparable.

In late December 2023, early Jan 2024, I did expect the 10-year treasury interest rates to stay range bound between 3.75% to 4%, with a downward trend moving to 3.25 to 3.5% by the end of 2024, equating to a risk premium of about 1% – given the AI euphoria I wasn’t expecting anything better, and markets do tend to lead, always expecting better times. That hasn’t happened and we’re instead at 4.4% today, which has put a cap on the index and rightly so.

Bottom line – We are slightly overbought and likely to see sluggishness in the index and that reinforces my focus on still finding great companies at bargains, bargains are even more important now.

Categories
Market Outlook

The 2% Fed Neutral Rate target Is a myth

The 2% Fed target is a myth and highly unlikely to be achieved. Historical CPI has been closer to 3%, and given the move away from globalization, and China decoupling in the past 3-4 years, that era of persistent disinflation is likely to be over. You saw Japan’s move.

That said – At least, I believe that beyond a certain point Fed induced higher interest rates will not name inflation, a lot of US inflation is fiscal, not monetary, the Feds know that and will cut for sure as insurance – nobody wants to derail the economy. I still think the three cuts of 25% each in 2024 are achievable. But to your point, yes, I don’t think we’ll go below a 3.5% treasury for a long, long time. I agree with energy stocks doing better in 2024, they will take up more space in the index. 

Categories
Market Outlook

Payrolls Report For March 2024

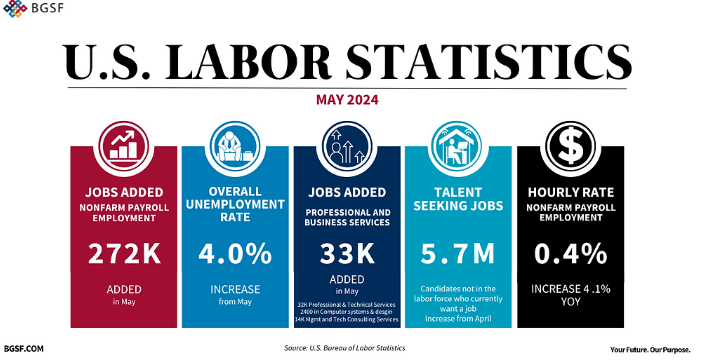
The much-awaited payrolls report is out

Strong numbers, up 303,000 much higher than consensus estimates of 212,000

Wage growth, 0.03 MoM, +4.1% annual, as estimated.

The unemployment rate inched down to 3.8% from 3.9%. Economists, on average, had expected the jobless rate to hold steady at 3.9%. Labor force participation rate of 62.7% vs. 62.6% consensus and 62.5% prior. This is a good sign.

Treasuries yields are at 4.37% up 7 basis points – expectations of rate cuts fade.

S&P Futures up 0.4%

Nasdaq Composite up 0.49%

The past few days there was a lot of consternation in the market, with reports about Fed cuts delayed or as one Fed Gov, Neal Kashkari suggested yesterday

The markets had fallen the last three days and looks stable at least for now. 

Categories
Market Outlook

Fed’s Preferred Inflation Gauge Eases in February, Matching Expectations

Fed’s preferred inflation gauge subsides, in line with consensus, in February

Core PCE Price Index, which excludes food and energy, rose 0.3% M/M in February vs. +0.3% consensus and 0.5% prior (revised from +0.4%).

On a year-over-year basis, core PCE increased 2.8% Y/Y, compared with the +2.8% consensus and +2.9% prior (revised from 2.8%).

Including food and energy prices, the PCE Price Index grew 0.3% M/M, less than the +0.4% expected and slowing from +0.4% in January (revised from +0.3%).

Prices for goods rose by 0.5%, bolstered by energy prices, and prices for services rose 0.3%. Food prices edged up 0.1%, while energy prices jumped 2.3% during the month.

2.5% Y/Y vs. +2.5% expected and +2.4% prior.

Personal income increased less than expected, up 0.3% M/M vs. +0.4% expected and +1.0% prior, the U.S. Commerce Department said on Friday.

Personal outlays climbed 0.8% M/M, exceeding the +0.5% expected and accelerating from +0.2% in January.

Real disposable income, which is adjusted for inflation, declined 0.1% M/M in February, while real personal consumption expenditures increased 0.4%.

Categories
Market Outlook

Macro Approach, Market Valuations, and the Outlook: Navigating Euphoria and Fundamentals

The Macro approach and historic valuations, market breadth, outlook.

Top down market strategy is relevant and sometimes essential when you want to compare the S&P 500 against historical benchmarks. I did this in a series of articles for seeking alpha under Fountainhead, and spoke about the same things that Hussman does – historical valuations, poor market breadth, interest rate correlations, smaller categories dominating, and future earnings being misleading especially when they start to falter. I still pretty much look at the macro backdrop every week even now, but it’s a great backdrop, an important framework and benchmark but not a primary factor or thesis for making individual stock decisions. I stopped doing the market outlook top down series a while ago, when I realized I was better off focusing on getting into the weeds, than trying to get better returns by forecasting market direction. As an example, I was trying to predict a 4-6% correction in the S&P 500 when the AI revolution was happening right before my eyes, again ironical because my first article recommending Nvidia was in October 2022 at $108! And that’s been the story for the better part of 3 decades. 

There are several who posit like Hussman and several rebutting parts or all of his thesis – the correlation with the Nifty Fifty gets the most pushback as does with the 1999 internet bust. In the 2007-2008 Great Financial Crisis bust, the financial sector had the highest concentration of the S&P 500, and financials are cyclical with P/E’s rarely exceeding 12-14, and then they were at 20, with expectations of 25% growth, their debt to equity ratios were like 33:1 – ABSURD!!. 

The point is – extremely difficult to compare the bull market euphoria peaks, and to a great extent that time is better spent getting into the weeds of individual stocks and also using the macro backdrop as a variable but not the prime one. Also how are we going to make better returns trying to time the S&P 500, through downturns or predicting bubbles?

A great company bought at a good price will also go through a drop when the market turns bad – sometimes only because the sentiment has turned and more often on its own demerits and reduction in earnings power, often we’ve overpaid or not taken profits when the going was good. There is no escaping the inevitable downturn, and we try our best to mitigate it. Profit taking is important, not chasing momentum is important; Not overpaying is equally important. Buying quality companies is very important. Diversification is important, I do want to have less tech or AI stocks and am always looking out for good ones in other sectors, without getting into value traps just because they’re cheap. There are a bunch of strategists who’re advising buying the Russell 2000 as a de-risking strategy because the gap between the valuations of the Russell 2000 and the Nasdaq 100 is the widest in decades. There is some merit in that, but de-risking is a strange way to put it, because by definition the Russell 2000 has the biggest loss making stocks with the highest earnings risk!

In terms of macro strategy, I put out the Factset S&P 500 monthly earnings report on the group, which I follow for the broader Price/ Earnings multiple, earnings and earnings growth. I will after the PCE report next week – in my opinion, the market is overpriced by about 10% for sure, the last decade P/E was about 18-19, we’re at 21 now, with the Index at 5,100 / $245 earning per share. If you look at the earnings yield it is 245/5100 = 4.8%. The first question you would ask is why am I investing in the market when the 10 year risk free treasury gives me 4.2%, what, am I getting only 0.6% extra for the extra risk?? The historical risk premium in the last two decades has been closer to 1.5%, I ran the numbers from 1962 for the articles I wrote, the other decades have their own idiosyncratic reasons and are not comparable.

Categories
Market Outlook

Patience in the Market: Accumulating Quality Stocks Amid Volatility

The main strategy is patience to get more margin of safety, especially when a solid company like Adobe gets clobbered 20% for a slightly lower than expected guidance. With a higher 10 year yield of 4.30, long duration tech stories always face more resistance, even more than the overall market. And there’s the volatility as you mentioned. By one measure, trading in options has surpassed that in the stock market for the first time since 2021, according to Goldman Sachs. 

https://www.wsj.com/livecoverage/stock-market-today-dow-jones-03-15-2024/card/frenzy-over-ai-and-nvidia-turbocharges-the-options-market-PijdBZpnDW4BfwZMerfM

I don’t see this froth, volatility and overpricing dissipating; Algo trading, ODTE, (one day expiry options) are pretty much a regular part of the markets now. For us the best strategy is to be patient with limits and accumulate in tranches, even if we miss some opportunities. The goal is a 3-5 year investment and we’re not timing or trading in the market so we’ll have to ride through the rough patches, with confidence in the fundamentals.