Fountainheadinvesting

Fountainhead Investing

  • Objective Analysis: Research On High Quality Companies With Sustainable Moats
  • Tech Focused: 60% Allocated To AI, Semiconductors, Technology

5 Star Tech Analyst Focused On Excellent Companies With Sustainable Moats

Categories
Market Outlook

SPY: Too Many Negative Indicators (Ratings Downgrade)

Summary

  • I’m downgrading my S&P 500 January Buy call to a Hold because of several negative indicators, including the massive tariffs levied on April 2nd.
  • While I had estimated an initial drop to 5,500, I’m reducing my lower target further to 5,000.
  • Caution and capital conservation now take precedence over growth.
  • Tariffs, inflation, weakening business sentiment, investor anxiety, and uncertainty remain significant concerns impacting the market outlook.
Bear Market - Recession
Douglas Rissing/iStock via Getty Images

In January 2025, I wrote an optimistic article recommending a Buy on the S&P 500 (SP500), (NYSEARCA:SPY), citing a still resilient economy, earnings momentum, AI optimism, and the re-emergence of animal spirits, trumping the negatives of tariffs, inflation, and uncertainty over government policies and immigration controls. But I also mentioned that we would likely see the index touching 5,500 before moving upward to 6,500. I’m now lowering targets even further to a possible 5,000 on the lower side with a recovery to 6,000 by the end of the year – essentially flat on an annual basis for the 1st year of the Trump presidency.

What Has Changed?

These are why I feel that the correction will likely lead to a possible bear market drop of 20%.

  1. The worldwide tariffs imposed on April 2nd.
  2. The sharp drop to a 10% correction in just 21 days.
  3. The feeble bounce back running into a strong 200 DMA resistance.
  4. Weakening economic indicators.
  5. The weakness in the M-7.
  6. Escalating trade tensions.
  7. Lower earnings could lead to lower multiples.
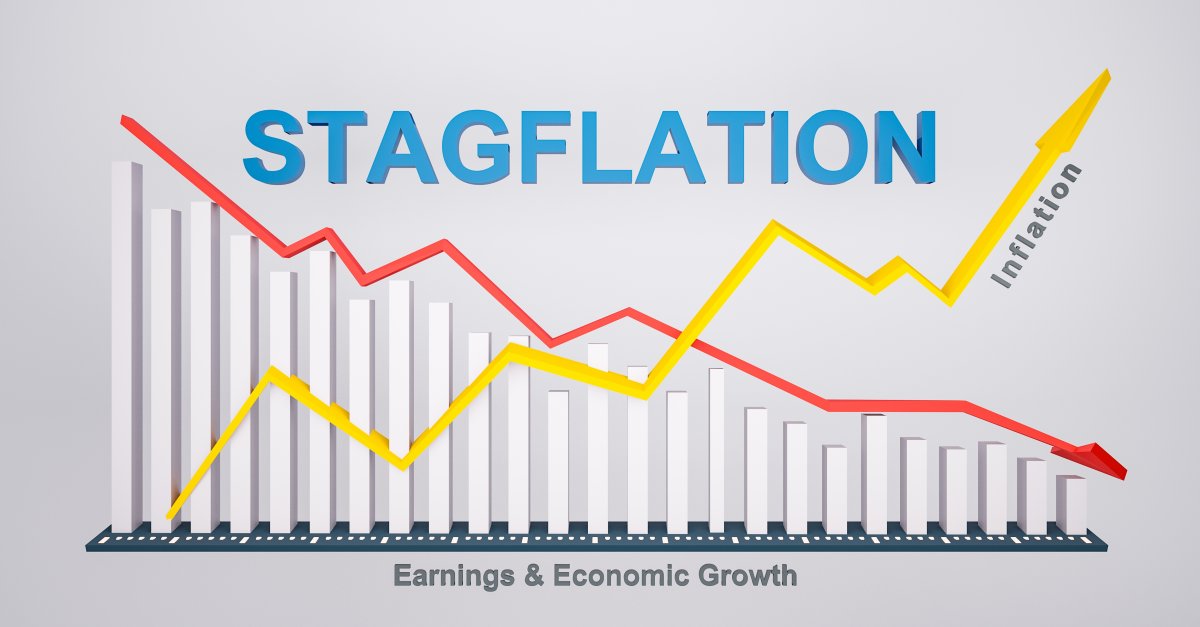
  8. Stagflation prevents the Fed from lowering interest rates.

The April 2nd Tariffs

The Trump administration imposed tariffs on our trading partners and nations across the world, in an effort to bring manufacturing back to U.S. shores.

Tariffs went up across the board, based on calculating the trade deficit with each nation and dividing it by 2, as a “Discount”. Here’s an example – China exported $438 Bn to the U.S. last year, but imported only $143 Bn, giving the U.S. a trade deficit of $295 Bn or 68% of $483 Bn; therefore, China’s tariff rate was calculated at 34%. The same formula was derived for each trading partner, with a minimum of 10%. Here is the complete list.

According to Deutsche Bank economists, the average tariff rate on U.S. imports would go up from 9% to a range of 25% and 30%.

As of writing, the S&P is down 3.57% to 5,469, 11.4% from its high of 6,147, in firm correction territory and, in my opinion, heading to a bear market drop of 20%.

While the tariffs were created to bring more jobs back to the U.S., by inducing exporters to set up plants in the U.S., that would take a decade, in my opinion, and a significant amount of Capex, subsidies, and private-public partnerships.

For example, TSMC (TSM) is estimated to have spent up to $65 Bn on its Arizona plant, which took about 5 years to get running and included about $6.6 Bn in Chips Act subsidies, and $5 Bn in loans. Secondly, it would be extremely difficult and expensive to make products like the iPhones because we’ve lost the process manufacturing expertise. The iPhone was designed in the U.S. but made in China by Foxconn with chips from TSM – from 2008 to 2025, which is 17 years of process manufacturing expertise that the U.S. will find difficult to regain at a reasonable price – It took India close to 5–7 years to get some of the iPhone manufacturing right, and that too under Foxconn control.

In the meantime, the U.S. consumer is likely to get an additional inflation shock of 1.5%, which could tip the country into a recession.

The Sharp Drop

The market dropped to 5,504 on March 13th, a correction of 10% from its February 19th top of 6,147, in an amazingly short span of just 21 days. At 6,147, the S&P 500 had made a double top compared to the previous high of December 6th of 6,099, which itself should have been a warning of the market topping out. The sharpness of the drop made it the 11th fastest in history.

Here are the 59 corrections, and not surprisingly, the COVID-19 correction was the fastest. It does show weakness in being in the same bracket as a COVID-19 correction. The sharp drop denotes price action that reflects far too much anxiety and uncertainty from investors, especially when economic news hasn’t been comparably terrible. The last payroll report showed us at just 4.1% unemployment, which is close to full employment, and yet skittish investors drove the market down 10% in just 21 days!

History of S&P 500 Corrections (Isabel.net, Bloomberg Finance, Deutsche Bank)

The Bounce Back Had No Backbone

The feeble bounce back ran full tilt into a strong 200 DMA resistance line and fell like a rag doll.

I believed that the market was oversold, and it did recover for about a week, with at least one of the catalysts being the Nvidia (NVDA) GTC annual conference. I suspect another catalyst was the hope of less onerous tariff announcements. However, it ran into strong resistance at the 200 DMA line, getting to 5,776 on March 25th, as we can see below, and slid back in a few days, ending the month lower at 5,612. With the reciprocal tariff announcements on April 2nd, the index has failed to hold the 10% correction line and is down 11.4% as of writing.

Chart
Data by YCharts

Weakening Economic Indicators

I believe the soft indicators will eventually show up in the hard lagging data, such as unemployment, payrolls, and GDP reports:

I find the soft indicators of surveys and polls extremely useful, especially when a majority of them are moving in the same direction as they did in February and March. For someone like me who is heavily weighted towards high beta stocks, such as the Magnificent Seven, semiconductors, cyber securities, or fast growth stocks, they are a good warning sign of impending trouble. It gives me a chance to de-risk, which I did and saved about 15-25% by selling portions of my portfolio. It turned out to be a good hedge.

Small Business Survey

In a March 27th article, Barron’s reported pessimism among small businesses, citing the Fed’s small business survey; I strongly believe that this manifests in weaker employment and slower GDP growth from Q2-2025.

Small businesses, classified as fewer than 500 employees, are the biggest employers in the country, accounting for almost 50% of America’s workforce, and about 43% of the country’s revenues or GDP.

There is a wave of pessimism around this cohort for several reasons, mainly,

  1. Uncertainty over the passage or renewal of the tax cuts of 2017.
  2. Rising cost of production
  3. A lack of clarity over tariffs and labor.
  4. Delays in planning and budget outlays are expected because of these uncertainties.

Crucially, this cohort has lost the post-pandemic recovery momentum with revenue and employment stagnation and decline. Worse, it has added debt in 2024 to tide it over.

From the Barron’s article:

In 2024, more small businesses reported their revenues decreased (41%), than those that saw an increase (38%). That’s the first time that has occurred since 2021. Profitability was a bit better, with 46% of small businesses reporting they operated at a profit in 2024.

From the Fed Small Business Survey

“Small businesses, because of the uncertainty, are starting to feel the squeeze,” says Tom Sullivan, the chamber’s vice president of small business policy. Owners are not “poised for growth,” which Sullivan says is concerning, considering small businesses are a primary job and innovation generators within the U.S. economy.

The University of Michigan Sentiment Index

The March 14th reading was abysmal. Coming in at 57.9, 5.1 points below expectations of 63, it was a whopping 6.8 points below the previous month. The biggest contributors to the angst were:

  1. The rollercoaster of stomach-churning tariff changes and economic policies.
  2. High inflation expectations of 4.9% – the highest since 2022.
  3. Worse, long-run inflation expectations rose 3.9% from 3.5% in the previous month, a monthly jump not seen since 1993.

From the director of consumer surveys at the University of Michigan, Joanne Hsu:

Many consumers cited the high level of uncertainty around policy and other economic factors; frequent gyrations in economic policies make it very difficult for consumers to plan for the future, regardless of one’s policy preferences.

Stagflation – Higher Inflation and Lower Growth

During their March 19th meeting, the Federal Reserve, while leaving their benchmark rates unchanged, made three key changes from their January meeting estimates.

  1. Inflation expectations rose from 2.5% to 2.7%
  2. GDP estimates lower from 2.1% to 1.7% – that is a large decline.
  3. The unemployment rate was revised to 4.4% from 4.3%

Stagflation hurts at both levels, and also hamstrings the Fed from reducing rates fast enough to revive the economy if GDP and employment falter.

The tariffs levied as of April 2nd will likely increase inflation by another 1.5% and reduce GDP growth to 1%.

Weakness in the M7

The Magnificent 7 stocks, which take up the lion’s share (31%) of the S&P 500 index and are a ubiquitous presence in our lives, have fallen like nine pins in this quarter. All of them are down over 20% from their 52-week highs, with Tesla (TSLA) leading the pack at 46%, followed by Nvidia at 33%. Everyone sells their family jewels last, and if the carnage is engulfing the best and the brightest, I think the S&P 500 will take a while to regain its footing.

Escalating Trade Tensions

Far from trade and tariffs being resolved through peaceful bilateral trade negotiations among business partners, the constant refrain coming from trade partners, friends, and neighbors has been one of disappointment and disgruntlement. Here are a few examples of where this is heading.

From Japanese Prime Minister Shigeru Ishiba, after the U.S. turned down personal appeals not to levy 25% tariffs on auto exports:

What President Trump is saying is that there are both friends and foes, and friends can be more difficult. This is very difficult to understand.

A diplomatic answer, but a firm one, which has now led to trade meetings between South Korea, China, and Japan, an unthinkable proposition a while back.

And neighboring Canada has retaliated. From Doug Ford, the pugnacious Ontario premier.

I’ve spoken with Prime Minister [Mark] Carney. We agree Canada needs to stand firm, strong and united. I fully support the federal government preparing retaliatory tariffs to show that we’ll never back down.

And this is after April 2nd, with China leading the pushback:

The tariffs “violate international trade rules, severely infringe the legitimate rights of relevant parties and represent a typical act of unilateral bullying,” the department said in a statement translated by The Wall Street Journal.

I believe trade tensions will continue, disrupting the global economy.

Lower Earnings and Growth Could Lead to Lower Multiples

The latest report from FactSet shows that S&P 500 2025 earnings estimates have dropped from $280 per share to $270 per share and are trending lower.
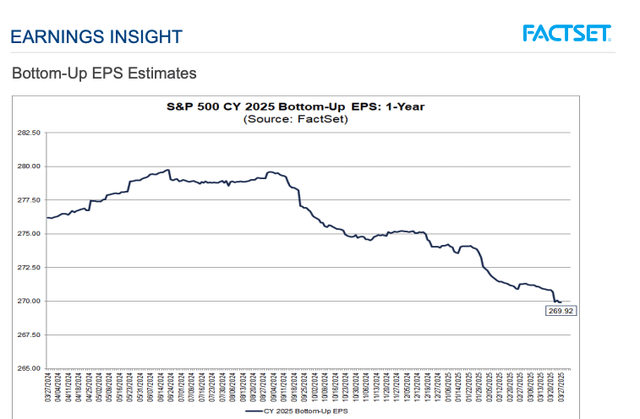
S&P 500 Earnings Per Share
S&P 500 Earnings Per Share (FactSet)

Further, even after the 10% correction, the S&P 500’s P/E ratio has barely touched the 5-year average of 20. And to everyone, the average of 20 had two positive components: corporate revenue and earnings growth, and lower interest rates. Now, with earnings declining, and the 10-year treasury yield over 4.2%, the P/E will veer towards the lower 10-year average of 18.2. Multiples always compress in tough times, and I don’t expect this time to be an exception.
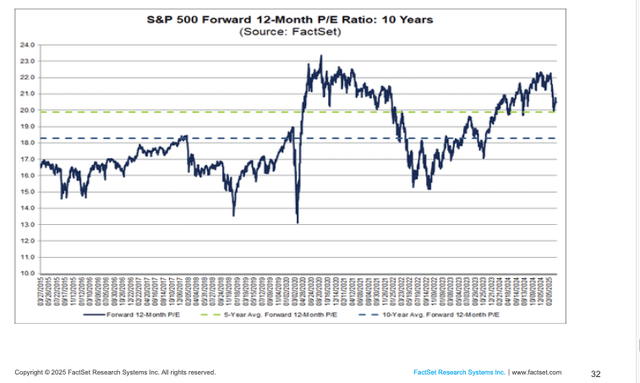
S&P 500 P/E Ratios
S&P 500 P/E Ratios (FactSet)

Goldman Sachs went even further, dropping their GDP outlook to just 1%, inflation to 3.5%, and increased unemployment estimates to 4.5%. Clearly, they too want to get ahead of it and have even lobbed in a dreaded recession estimate of 35%. I expect more to follow.

Stagflation Prevents the Fed From Loosening

On March 28th, the Core CPE – the Fed’s preferred inflation gauge inched up a little more than expected at 0.4% MoM versus the 0.3% consensus. It was also a tad higher than January’s 0.3%. That translated to an annual increase of 2.8% vs the 2.7% estimate. It, too, was slightly higher than the previous month’s gauge of 2.7%.

The CPE, which increased 0.3% MoM and 2.5% YoY, matched both monthly and consensus estimates.

Personal Savings grew as personal income exceeded personal spending!

Personal income grew +0.8% M/M, vs the 0.4% estimate, and beat the previous month’s 0.7%. It dwarfed personal spending, which only grew 0.4% MoM, thus allowing the personal savings rate to grow to 4.6% in Feb, V 4.3% in Jan. In a growing or steady inflationary environment that we’ve been seeing for the past years, it becomes exceedingly difficult for the Fed to lower rates when needed, without stoking inflation.

The Strategy For The Rest Of 2025

Coming back full circle, there are far too many negatives to ignore and just ride the AI train, which rewarded me very well for two years, and it would be more prudent to play defense, conserve capital, and raise cash. I think Warren Buffett’s $334 Bn cash hoard is telling us something.

As I mentioned in my last article, two years of 23% sequential gains have happened only 3 times in a century. The chances of a reversal or a stagnant market in 2025 are extremely high; thus, caution would be the biggest objective and strategy.

My portfolio is tech-focused, I’ve been taking profits on tech stocks intermittently, raising cash and diversifying into ETFs, consumer staples, defensives, and also looking at global indices.

Categories
Ad Tech AI Cloud Service Providers Industry Stocks

Amazon Is A Good Bargain At $202

I’ve been adding Amazon (AMZN) to my portfolio in the past week; it is a bargain at $202, having dropped almost 20% from its high of $242.

Amazon has 4 businesses.

Amazon Web Services

AWS is a cloud services behemoth and market leader with $ 108 Bn in 2024 sales, and still growing at 19%. That is remarkable growth for a market leader of that size with two other 800-pound Gorillas, Alphabet and Microsoft, chasing it. It generated operating profits of $39 Bn last year, a growth of 66% with an operating profit margin of 37%. This is Amazon’s most profitable segment and the growth engine, which powers everything.

Advertising

Amazon includes its advertising revenues in the online retail sales segment, but its advertising revenue last year was estimated between $ 56 Bn to $ 64 Bn in 2024, growing around 20% a year. This is also a high operating margin business, generating over 20% in operating profits.

Prime Subscriptions

Amazon doesn’t disclose its Prime subscriber numbers, but we estimate about 200Mn subscribers, including 180Mn in the US in 2024, generating over $40Bn in revenue.

This is another sustainable, sticky, and high-margin business, I’d value it at about 9x sales or $360 Bn.

I used a 9-10x multiple for the high-growth, high-profit margin, and sustainable businesses.

Online and physical retail sales in the US and abroad

These include third-party sales. Physical sales revenues are minuscule compared to total retail sales; loss leaders to expand reach and for analytic purposes, including in the online retail business. Amazon had a whopping $ 431 Bn in 2024. While online domestic and international sales are a drag, growing slower in single digits, they’re not significantly slower than Walmart’s sales growth and margins.

Amazon Segment Sales: Sources Amazon

Based on the Sum of the Parts schedule above, we’re getting the online and physical retail operations of $431 Bn at a market cap of just $170 Bn. The multiple of 0.4 is much lower than Walmart’s multiple of 0.74, or 40%.

Amazon has been spending heavily on Capex for AI to gear AWS and expand its web service offerings. In this arms race, they are scheduled to spend $100 Bn in 2025 to maintain and possibly expand their leadership.

We haven’t even valued all their investments and partnerships under AI development. That can be very valuable in the future.

I’d continue to buy the stock on declines.

Categories
Market Outlook

A Lack Of Consumer Confidence

Market Outlook: Conference Board’s Consumer Confidence Index

Anxiety is rife as Conference Board’s Consumer Survey Drops to a 12-Year Low

A Negative view: The February survey of household sentiment showed that expectations for income, business, and labor-market conditions fell to a jaw-dropping 65.2, a 12-year low. A level below 80 often signals a recession, according to the Conference Board.

And it’s not just forward data – Consumers’ view of the current situation fell to 92.9, V 93.5 expected, down 7.2 MoM, marking four straight months of declines.

Still, there were silver linings, such as the view on labor markets –
33.6% of consumers said jobs were plentiful, no change from the previous month, while 15.7% disagreed, claiming that jobs were hard to get, which was also unchanged from 16% in February.

Inflation remained a major concern, with consumers outlining trade policies and tariffs as root causes.

The Fed balances real-time data with these surveys, as do Wall Street and other analysts, looking for cracks in the economy. So far, nothing has translated into actual reports, which naturally lag these leading indicators. Unfortunately, these turn out to be self-fulfilling prophecies towards a vicious downward cycle unless turned around quickly.

The Fed’s dilemma to balance and maintain the dual mandate of full employment and low inflation continues, as soft data from forward-looking surveys convey anxiety about the economy, data which has yet to show up in current reports such as monthly payrolls, unemployment claims, the JOLTS report, or the GDP numbers. Should these weak surveys show up in the jobs numbers, the Feds would have a hard time justifying rate cuts to goose the economy given stronger and stickier inflation.

Categories
Market Outlook

A Balanced Chair Powell At The FOMC Press Conference

I thought that Chair Powell was impressive at the FOMC March 20th, press conference. He came across as very balanced, cautious, and data-dependent. Clearly, these are not easy with the chaos emanating from the executive branch, and handling an economy that was headed for a soft landing which now may get derailed needs kid gloves.

Chair Powell paid heed to the soft data – forward-looking surveys for inflation and tariffs from sources like the Michigan Consumer Sentiment Index and the PMIs; data that points to softness and uncertainty in the economy borne out of tariffs, deportations, and higher inflation expectations, which all seemed under control just a few months back. He balanced it with what’s showing up as reported, which is nowhere as bad, clearly the surveys are just leading indicators for now.

The Fed’s revised numbers for 2026 are as follows:

  • Inflation 2.8% from 2.5%
  • GDP lower at 1.8% from 2%
  • The Unemployment 4.4% from 4.3%

Given that the softer surveys are not showing up in the reported numbers yet, the proposed strategy is to wait and watch.

When pressed about why he’s going ahead with two rate cuts when clearly inflation is not below the 2% objective, he stressed the Fed’s dual mandate of full employment – which needs cuts in the face of a weakening economy, and tariff uncertainties.

Similarly, he also stressed that the weaker data wasn’t yet showing up in the job numbers, which meant that they were in no hurry to cut, but were ready and willing to act as required. 

I believe the markets heaved a sigh of relief that they haven’t called for more or earlier cuts: I agree with the notion that they’re going to live with higher inflation but not let the economy falter. It is the right way to go. The S&P closed 1.17% higher for the day. At least its moving up from correction territory.

The word transitory came up, a bad penny that’s never left Chair Powell. I understood it as transitory similar to Trump’s first term, in the sense, that they still don’t know the impact. He emphasized that it’s not “transitory” like the mistake they made post-COVID in 2021, and scrambled to raise the rates in 2022. That seems fair.

The bottom line – a lot of ponderables, and moving parts. Clearly, we’ve got our work cut out to make money in 2025! Many have never seen a stagflationary environment and to be sure it is going to be tough navigating it.

In the shorter term, I would expect the S&P 500 to rise a bit more, there is the 200DMA hovering at 5,705, which is a key resistance level – hopefully, we clear that before the PCE next week.

Categories
AI Industry Semiconductors Stocks

Nvidia GTC Keynote – CEO Jensen Huang

Quick Key Takeaways: Worth every minute. I own shares and will add on declines.

Incredible product road map:

Blackwells are in full production and Blackwell NV72 is expected in 2H2025. Some may quibble about a “delay, ” as investors expected Q1 or Q2 of strong sales from NV36 and NV72, but it hardly makes a difference in the long run. In the worst-case scenario, the stock could drop 10-15%, but that should attract buying unless other macroeconomic uncertainties cause a continuous slump in the market/economy. I would back up the truck at $100.

Rubin, which is the next series of GPU systems, will be available in the second half of 2026 – again a massive leap in performance.

Nvidia (NVDA) has a 1-year upgrade cadence,

a)Nobody else has that

b) It’s across the board, GPUs, Racks, Networking, Storage, and Packaging the whole ecosystem of partners.

Nvidia’s market leadership is going to last a while – That is my main investing thesis, and I can withstand the short-term bumps.

Cost Analysis: I’m glad Jensen spoke about this in more detail and what stood out for me was a clear-cut analysis of reducing variable costs as their GPU systems get smarter and more efficient to bring total costs (TCO) down. Generating tokens to answer queries is horrendously expensive for Large Language Models, like ChatGPT and it was a black hole.

I expect costs to come down significantly, making the business model viable. Customers are expected to pay up to $3Mn for the Blackwell NV72, and it has to become profitable for them.

Omniverse, Cosmos, and Robotics, – are other focus areas to go beyond data centers. Nvidia needs other target markets, industrials, factories, automakers, and oil and gas companies to embrace AI and therefore use of their GPUs, to reduce their dependence on hyperscalers, and Jensen spent a lot of time on them. He also emphasized enterprise software partnerships, for AI, and gaining full acceptance as a ubiquitous product and making extra revenues. For Nvisia’s vision of alternate intelligent computing, we have to see more Palantirs, Service Nows, and AppLovins. In my opinion, Agentic AI will make serious inroads in 12-15 months.

I’ll add more detail in another note, once I parse the transcript in detail.

Bottom line – this is going to be an incredible journey and we’re just at the beginning; Sure it’s going to be a bumpy ride, and given the macro environment, it would be prudent to manage risks by waiting for the right entry, and taking profits when overvalued or overbought, or if you have the expertise, using other hedging mechanisms. I’m sold on Jensen’s idea of a new paradigm of accelerated and intelligent computing based on GPUs and agents. Nvidia is best positioned to take full advantage of it.

Categories
AI Cloud Service Providers Industry Semiconductors Stocks

Credo Technology (CRDO) $46 Is A Great Pick And Shovels Play On AI

While all eyes and ears are on tariff uncertainties and geopolitical risks, we remain focused on finding good investments for the long term – tuning out the drama and volatility.

Excellent Q3-FY2025 results

Credo Technologies (CRDO) supplies high-quality Active Electric Cables (AECs) to data centers, counting on Amazon, Microsoft, and other hyperscalers as its biggest customers. The stock dropped 14% today to $46.75 in spite of excellent Q3-FY2025 results with a 154% increase in sales to $135Mn Vs $120Mn expected and a sizable improvement in gross and operating margins, which is unusual when you’re ramping up production for a customer like Amazon.

Revenue guidance for the next quarter was even more impressive at 162% growth to a midpoint of $160Mn. For the full year ending in April 2025, Credo is expected to grow revenues to $427Mn – a whopping 121% increase, over the previous year.

Good pick and shovels play in data center and AI

Credo is a pick and shovels AI/GPU/Data center play as data centers ramp up all over the world for accelerated computing. Its key products are essentially AEC replacements for optical cables — a play on back-end networking of high, and reliable bandwidth for data center GPUs and GPU systems like the Nvidia Blackwell N36 and N72, which are expected to start ramping up in the 2nd quarter of 2025.

Data center equipment suppliers have become very crucial parts of the AI/GPU supply chain, and Credo’s results certainly speak volumes of their capacity to scale and scale profitably, which is even more admirable.

Its founders are from Marvell (MRVL), there is a fair amount of credibility and experience.

They are general purpose and custom silicon agnostic, which is good because get business from Nvidia and from ASIC players like Amazon and Google.

The business is also GAAP breaking even in FY2025, another exception for such a small company.

Credo had gross GAAP margins of 63.6%, and GAAP operating margins of 20% and a stunning Adjusted Operating Margin of 31.4%, which is astonishing for a fledgling 400Mn operation with Amazon as its main customer.

Key Risks 

Customer concentration – not likely to change soon, the nature of the industry currently needs high volume from hyperscalers.

AEC cables will become a commodity after 3-5 years, so they’ll need to maintain their growth without dropping prices.

Valuation

Credo’s valuation is not expensive at 11x sales as the revenue growth is easily going to surpass 60% in FY2026 and 30% in FY2027, after growing 120% in FY2025. The P/S to growth ratio drops to a low of 0.2 with such high growth. Furthermore, it has an operating profit margin of 20% easily adding to more than the rule of 40, or 60+20 = 80.

The drop today was ostensibly because of customer concentration – Amazon 68%. But analysts and investors should have known this; I believe the correction is overdone and Credo should resume its upward march again. I bought at 45.75 today, the stock is down almost 50% from its all-time high of $86.69, but still up 187% in the past year.

I’m targeting a return of 24% per year or double in 3.

Categories
Market Outlook

Slumping Consumer Confidence Doesn’t Bode Well For The Market

Market Outlook – Consumer Confidence

Consumer confidence slumps more than consensus in February, with the index coming in at 98.3 vs. 103.0 consensus and 105.3 in January (revised from 104.1), according to data released by The Conference Board this morning,

The drop was severe, and the most since August 2021 on concerns about the outlook for the broader economy – uncertainty over the Trump administration’s policies weighing on households. 

I had posted on Friday, stating that a plethora of weaker economic indicators was likely to lead to a drop in the market and this one added to the market’s woes, which at writing was down about 1% to 5,940 – some 3% lower than its high of 6,147.

The Conference Board’s gauge of confidence decreased by 7 points in February to 98.3, the third straight decline.

The expectations index ( 6 months) sank 9.3 points to 72.9, the most in three-and-a-half years, while a gauge of present conditions declined more modestly 3.4 points to 136.5

Recession woes and worsening outlook: The drop in confidence was broad across age groups and incomes, with consumers more pessimistic about current and future labor-market conditions, as well as the outlook for incomes and business conditions. The DOGE cuts are not helping confidence for sure.

The consumer board report, didn’t mince words about the severity of the decline.

“In February, consumer confidence registered the largest monthly decline since August 2021,” said Stephanie Guichard, Senior Economist, Global Indicators at The Conference Board. “This is the third consecutive month on month decline, bringing the Index to the bottom of the range that has prevailed since 2022. Of the five components of the Index, only consumers’ assessment of present business conditions improved, albeit slightly. Views of current labor market conditions weakened. Consumers became pessimistic about future business conditions and less optimistic about future income. Pessimism about future employment prospects worsened and reached a ten-month high.”

The dreaded R-word, which had been buried under the AI boom resurfaced, – the share of respondents expecting a recession in the next year rose to a nine-month high.

Tuesday’s report reinforces other surveys that I had cited, showing a doubtful and hesitant populace, waning after an initial surge of animal spirits post-election. Tariffs and higher prices dominate the conversation, as they did in the Michigan sentiment survey,  as inflation pressures pick up again and the labor market suddenly looks shaky. One would wonder if the DOGE leadership thought through their actions and the effects on the economy with all the government layoffs. Clearly, the mood seems to have soured.

I continue to be extremely cautious, and will only buy exceptional bargains, I believe the S&P 500 could correct to 5,780 – the pre-election level, after which I would re assess the market before entering again.

Categories
AI Market Outlook Stocks Technology

Risk Management And Portfolio Strategy

I sold 15-25% of several stocks on Friday, 02/21/2025 as a de-risking exercise in the wake of weakening economic indicators, which I wrote about in this article.

Here’s the list and you can see them in the Trade Alerts Section as well.

ARISTA NETWORKS (ANET) $101

ADVANTEST CORP SPON ADR (ATEYY) $63

AMAZON INC (AMZN) $218

APPLIED MATERIALS INC COM (AMAT) $174

APPLOVIN CORP COM CL A (APP) $430

ARM HOLDINGS PLC (ARM) $147

BROADCOM INC COM (AVGO) $222

DOORDASH (DASH) $201.65

DUOLINGO INC CL A COM (DUOL) $410

DUTCH BROS INC CL A (BROS) $80

GITLAB INC CLASS A-COM (GTLB) $65.75

KLAVIYO INC (KVYO) $42.75

MICRON TECHNOLOGY INC (MU) $101

NETFLIX (NFLX) $1,012

SAMSARA INC (IOT) $54.25

SPOTIFY TECHNOLOGY S.A. COM (SPOT) $626

Earnings alone won’t save this market from a correction

Earnings season for Q4-2024 is mostly over except for Nvidia (NVDA), which reports on 02/26.  M-7, and overall earnings were mostly lackluster and while most beat sandbagged estimates as always, the beats were nothing to write home about.

Instead, there was a lot of pressure for Q4 earnings to outperform to trump bearish indicators such as stubborn inflation, high valuations, tariff uncertainty, the likelihood of no interest cuts in 2025, difficult housing markets with 7% mortgage rates, weakening consumer sentiment, and so on….

Analysts, according to FactSet are still forecasting an estimated $268-$275 in 2025 S&P 500 earnings (about 11.5% growth), but this number seems more and more likely to either come in at the lower end or be revised lower as the year progresses. Second – the two-year back-to-back gains of 23% are a historical anomaly so I have to keep that in mind of a likely down year or a flat to 7-8% gain from already high levels.

Against all that is the $320Bn in Capex from the hyperscalers (That’s real money, not an economic survey or estimate  – therefore the strongest catalyst ), which is extremely good for the AI industry and a very strong and vocal belief in the fundamentals – longer term we are on solid footing, and the AI story is just beginning, there are a lot of benefits to reap.

Active Risk Manangment

In short – a balancing act, which means there has to be active risk management. And especially when almost all the economic indicators came worse than expected, with sticky inflation and slower growth – stagflation. The Michigan survey of inflation expectations is followed closely by the Feds, and the weakening PMIs coincide with Walmart’s lower guidance. The reports have a lot of meat and don’t paint a pretty picture.

I’m not selling/trading the index or the stalwarts like Apple (AAPL), and Alphabet (GOOG) – there will be a flight to quality, thus not recommended. Even with a correction I don’t see the S&P 500 falling beyond 5,600-5,780. 5,780 was the Nov 5th election day level, that’s just 3.8% lower, not worth it.

My portfolio is tech-centric, and sometimes the drops in those are between 20% and 30% – AppLovin (APP), Palantir (PLTR), and Duolingo (DUOL) are examples, plus they’ve performed far better than expectations so taking some off is a great de-risking strategy for me.

Categories
Market Outlook

Market Outlook –  Economic Indicators Suggest A Possible Correction

There has been a spate of economic indicators in the past week or so, which are bearish for the market indicating a possible correction or at the very least a level of caution.

Let’s take a look.

The PMI – The Purchasing Manager’s Index – a 17 Month Low!

S&P Global released its Flash US PMI Composite Output Index, which measures activity in the manufacturing and services sectors. 

The index fell to a 17-month low at 50.4 in February, down from 52.7 in January, indicating that activity had slowed to a virtual standstill. Worse, cost inflation accelerated even with the lower activity, and was absorbed by suppliers who were unable to pass it on – indicating a possible stagflationary spiral.

Economists didn’t see it coming with expectations of 53.

What were the main causes?

From Trading Economics, emphasis mine:

It also marked the slowest pace of business expansion since September 2023, driven by a renewed contraction in services output that partially offset faster manufacturing growth. New order growth weakened significantly, while employment edged lower amid rising uncertainty and cost concerns. On the price front, input cost inflation accelerated to its highest level since last September, while selling prices saw their slowest increase in three months. Finally, business optimism about the coming year slumped to its lowest since December 2022, except for last September, amid concerns over federal government policies related to domestic spending cuts and tariffs, as well as worries over higher prices, and broader geopolitical developments. 

Source: S&P Global

The University of Michigan Sentiment Index

The University of Michigan’s consumer sentiment index fell to 64.7 in February from 71.7 in January. Economists polled by FactSet were expecting a much better 67.5. 

Year-ahead inflation expectations rose to 4.3% from 3.3% in January. This is a worrying sign, high inflation expectations hurt the mass consumer and spending.

Tariffs are scaring consumers as all five index components weakened this month, with durables lower by 19% mostly on ears that tariff-induced price increases were imminent.

From the University of Michigan website:

Year-ahead inflation expectations jumped up from 3.3% last month to 4.3% this month, the highest reading since November 2023 and marking two consecutive months of unusually large increases.

Current Conditions Index: 65.7 vs. 68.7 expected and 75.1 January.

Consumer Expectations Index: 64.0 vs. 67.3 consensus and 69.5 prior.

Housing:

January was no exception, continuing the trend of the past two years, which saw high mortgage rates decimating housing, U.S. existing-home sales declined 4.9% in January from the prior month:

According to the Wall Street Journal,

Existing home sales of 4.08Mn also came in below expectations at 4.11Mn.. Economists surveyed by The Wall Street Journal had estimated a monthly decrease of 2.6%. In 2024, home sales fell to the lowest level since 1995 for the second straight year.

First-time home buyers seemed to be priced out by the double whammy of higher prices and high mortgage rates. I had reported earlier that the brave home buyers from 2022-2024 would feel the pinch of not getting to re-finance their 6-7% mortgage and clearly, few takers are willing to take that risk now.

Cash is at a record low:

According to the BOFA Global Fund Manager survey, cash is at 3.5% – the lowest level since 2010!

That begs the obvious question? With only 3.5% cash what’s left to buy the dip? With over-ownership of the M-7, these stocks aren’t just overbought, a) There’s previous little cash left to buy when the prices get attractive and b) You already own all of them, where’s the room to add more?

Goldman Sachs is advising caution:

Scott Rubner from Goldman believes that the “Buy The Dip” could fade:

We could be in a fading, twilight of a bull run and headed for a correction according to Scott Rubner, managing director for global markets and tactical specialist at Goldman Sachs.

Rubner was categorical in stating the good times from corporate buybacks, retail investors jumping in on every dip, 401k inflows, and beginning of the year investing was waning, and once the corporate buyback period went into the quiet period for Q2, fund flows would move away from equities.

According to Rubner:

“My highest conviction is that this massive ability to buy dip alpha is starting to wane.” Rubner also said that hedge funds have allocated a lot of risk back into the market. Global equities saw the largest net buying in two months last week.

Rubner backed his findings with two key statistics; His assessment that computerized trading desks selling triggers, in the event of a market dip would unload $62Bn worth of equities compared to just $9.55Bn of buying on buying signals – pretty asymmetric towards the downside. Secondly, he also cited “A net retail buy imbalance for the last 22 days, including the top three largest days on record, he said. “This cohort is happy to buy any 2-3% dips for now.”

Q4-24 Earnings weren’t good enough:

The FactSet report on S&P 500 Earnings on 02/14 was just average and for this market to keep rising average won’t do – the valuations The M-7, bellwethers were also sluggish and will have a hard time taking the indices higher.

And while I’m positive about AI, semiconductors, and several fundamentally strong tech companies, valuations have been stretched for a while, thus it would be prudent to take advantage of some of the prices by booking profits, which I have started and posted in the trade alerts section.

While a set of economic indicators doesn’t necessarily doom the market, the downside surprise indicates that we’re not paying enough attention to economic weaknesses, against a backdrop of stretched valuations and interest rates that refuse to fall. The correct de-risking strategy would be to sell and keep cash available for better bargains.

Categories
AI Cloud Service Providers Industry Semiconductors Stocks

Nebius (NBIS) $45 Has Long-Term Potential But May Be Priced To Perfection


While Nebius has shot up 135% in the past year and is approaching fever pitch as a speculative AI infrastructure investment, it does have long-term potential to justify buying on declines.
Nebius was carved out of the Yandex group, an erstwhile Russian company, known as the Yahoo of Russia. After sanctions due to the Ukraine war and the resulting spinoff, this is a European company with US operations with little or no Russian exposure or additional geo-political risks.
Nvidia has a 0.3% stake in the company, and a strategic partnership to expand AI infrastructure to Small and Medium businesses beyond hyperscalers.
Nebius has five revenue segments – Data Center, Toloka, Triple Ten, Clickhouse and AVRide.

I want to focus on the main data center segment in this article.
Datacenter
The best and most strategic segment is the data center, and the key reason to invest in the company is to take full advantage of AI needs beyond the hyperscalers. I expect at least 100% annual revenue growth in the next two years from the data center, slowing down to 50% in year 3.
Nebius is going all out in creating enough capacity for demand in the next two to three years.
It launched its first data center in the US, in Kansas City to start operations in Q1 2025 with an initial capacity of 5 MW, scalable up to 40 MW.
Further expansion plans – most likely all of that is Nvidia’s B200 GPUs.
• Finland 25MW to 75MB by late 2025 or early 2026.
• France – 5MW Launching in November 2025.
• Kansas City – Second facility with 5MW to expand to 40MW.
• One to two further greenfield data centers in Europe.
Datacenter offerings: Either as computing power or GPU rentals, or the more specialized PaaS (Platform As A Service) with its AI studio, which gives customers choices of OpenAI or DeepSeek models among others. It is priced based on usage and token generation to cater to medium-sized, smaller, and/or specialized domain-specific customers.
Fragmentation likely: As the AI data center industry progresses, I believe, Inferencing and modeling requirements will be fragmented and domain-specific. The DeepSeek software and modeling workarounds do suggest this market could easily be targeted by customized requirements, where brute computing power as the norm will morph into specialized or customized requirements. In which case while customers could contract for larger GPU training clusters, they would also look for cheaper inference solutions, which rely on software enhancements. This is likely to happen over time and may well work to Nebius’ advantage since they want to go beyond pure GPU rentals and provide a full stack – this could be both a challenge and an opportunity and it would be crucial to get more visibility in Nebius’ offerings or services as the year progresses specially compared to competition like CoreWeave.
Lowering training costs: While there remains a huge cloud about what DeepSeek did spend on training, and even as 2025 seems to be secure because of the large Capex of $320 Bn committed by the hyperscalers, it would be remiss to not acknowledge that the trend would seek lower training costs as well – in which case a) data center computing power will be at risk and b) pricing could be the main differentiator. As of now, Goldman Sachs is projecting data center demand to exceed supply by about 2:1, and the gap is unlikely to be filled even with rapid deployment through 2026.
Spend more to earn more: Most of the forecasted growth is based on Capex possibly over $2.5Bn in 2025 with an additional $2.5Bn to $3Bn in 2026. Currently, Nebius is well capitalized with about $2.9Bn in cash, but if data centers don’t generate enough cash, there could be dilution to raise more capital or the sale of stakes in their 4 other businesses. This is very likely to happen in 2026.

Negatives and challenges

Provide value to customers beyond brute computing power: Over time data center rentals will get commoditized and become price-sensitive. The DeepSeek modeling workarounds do suggest that brute computing power will morph into smaller specialized or customized requirements. This could also work to Nebius’ advantage, since they can provide a full stack, i.e. –a challenge and an opportunity.
Pricing could be a challenge: The trend towards seeking lower training costs should continue – as of now Goldman Sachs is projecting data center demand to exceed supply by about 2:1, and the gap is unlikely to be filled even with rapid deployment through 2026, but Nebius needs to stay on top of it, to ensure they generate enough cash to continue spending on growth.
High Capex Needs: Most of the forecasted growth is based on Capex possibly $2.5Bn to $3Bn in 2025 and 2029 each – currently Nebius is well capitalized with over $2.9Bn in cash, but investors will need to be patient with this outlay first and prepared for dilution.

Valuation:

Nebius had forecasted to reach an ARR (Annual Recurring Revenue) Run Rate of – $750Mn to $1Bn for 2025, which is based on about $60-80Mn of ARR in Dec 2025 times 12. It’s not the ARR in February. It would grow from the current $300 Mn to $ 875 Mn by the end of 2025. Normally annual revenues are much lower than ARR – a lot of ARR is deferred revenue because the ARR includes contracted revenues, which are then pro-rated for the year. An ARR of $875Mn at the midpoint could imply 2025 revenue of between $400 and $500Mn. (This is still about 3x the estimated 2024 revenue of $137Mn – so there is tremendous growth. (But at this stage a lot of estimates!)
At a market cap of $10.4Bn, we’re looking at over 20x to 25x, 2025 revenue, so the price may have gotten ahead of itself.
This is a thinly traded company with rampant speculation, and I think the best move would be to sell 25% to 50% before earnings, should the quarterly results and forecasts disappoint. I’m already making a decent profit in a short time and keep the rest for the long term. Nebius reports pre-market on Thursday 20th, Feb.
I would like to see more visibility before committing to invest more.

Competition

CoreWeave (which is private) and also an Nvidia strategic partner had estimated revenue of $2.4Bn in 2024, and with the addition of 9 new data centers to 23 very likely to have around $8Bn of sales in 2025.
CoreWeave was last valued at around $23Bn but is targeting an IPO valuation of $35Bn thus giving it an estimated sales multiple of anywhere between just 4-9x for 2025, way below Nebius.
Even if we assume that the other businesses contribute an additional 25% or $125Mn in 2025 revenues we’re still valuing Nebius much higher than CoreWeave – a larger and more established competitor with Nvidia as a partner, and Microsoft as a customer.

That makes me wary; I’d be happy if my sales estimates are too low, but if they are not, then I would rather wait for dips.